
What you'll need to know...
KEY CONCEPT - The effects of global climate change on places, societies and environmental systems
Climate change and the hydrosphere, atmosphere and biosphere, including:
• water stored in ice and oceans, and changing sea levels
• carbon stored in ice, oceans and the biosphere
• incidence and severity of extreme weather events, including drought
• spatial changes in biomes, habitats and animal migration patterns
• changes to agriculture, including crop yields, limits of cultivation, soil erosion
Impacts of climate change on people and places, including health hazards, migration and ocean transport routes
Synthesis, evaluation and skills opportunities
The uneven spatial distribution of effects and uncertainty about their timing, scale and impacts for individuals and societies
Climate change & ..... water stored in ice and oceans, and changing sea levels
|
Objective - Discuss the causes and consequences of the changing balance between water stored in oceans and ice. Task 1 - Click here to access a short tutorial page about the changing balance of water stored as ice and the sea. Watch the animation carefully, and then complete the worksheet tasks by clicking on the tab to the right. i. What different environmental factors could be causing melting of the ice in the two tanks? ii. How has the melting of the ice affected the water level in both tanks? Extra Reading: Study this article from New Scientist and this one too from phys.org Make notes on the content of both articles including the common misconceptions that exist in this field of research. Task 2. Click here to access a news article on the melting of the Greenland ice sheet. Please summarise the article using the following headings: a. Location b. Issue c. How is it measured d. Potential effects Task 3 - The North West & North East Passages. Mapping Starter Click here to be taken to a blank map of the world. Follow the instructions on the page. Now click here and mark on the routes taken by ships on both the Northwest and Northeast passages. You can use the help diagrams on the second side to help you. Finally, go back to the first sheet and mark these new routes with a different colour. Task 4 - Much of the news out there rightly cites the negative impact of sea level rise on the world, however, the video to the right hand side studies the implications of ice melt on improved shipping routes in the Arctic. Watch the video (to the right) and then read the article from the BBC in the first tab below followed by the second article. Whilst doing these tasks, you should take notes on the implications ( + / - ) of this new shipping route on future trade and geopolitical relations. Use screenshots from the video as well as graphics from the news articles to illustrate your notes with key data, route and emissions. |
Extend your understanding Use the video to the above to take notes on why sea level rises are recorded to be much higher in certain parts of the world (like New York) than others. It may help to take some screenshots of crucial parts of the video to help revision at a later date. |
Climate change & ..... carbon stored in ice, oceans and the biosphere
Choose one of the following two tasks.... (either Task 1 or Task 2)
Task 1 - Download the document above and save / print out and place into the sub folder for this unit of work. Complete the following tasks using the information contained within the 12 pages.
a. Outline briefly where carbon is present.
b. What is the name given for a store of carbon and what is the name given to the movement of carbon between two stores?
c. Give an example of three of these movements in the cycle then make a brief copy of figure 1 on page 1 of the document.
d. How does the carbon cycle link into the atmospheric energy budget (first lessons in this unit of work)?
e. Outline the relationship between carbon sources and carbon sinks.
f. What does the abbreviation 'pg' refer to and how it is calculated?
e. Create a spider diagram / bullet point list showing the four major carbon pools with a 50 word max explanation of each including pg data.
f. Create a further spider diagram / bullet point list that shows the five natural carbon fluxes.
g. Make note on how human activity can cause fluxes to occur focusing on fossil fuel combustion and land use change.
or...
Task 2 - Using this worksheet and this weblink, complete the activities set out.
Task 3 - Using the evidence board below, complete three separate fact sheets (in groups of 3 if possible) that show the impact of climate change on carbon emitted by ice (glaciers), oceans and the biosphere.
Evidence Board 1 - Ice (glacial retreat)
Please use the worksheet above to complete the following three tasks.
|
|
|
Evidence Board 2 - Oceans (acidification)
|
|
|
Evidence Board 3 - Biosphere (rainforest deforestation)
|
|
|
Climate change & .... incidence and severity of extreme weather events, including drought
|
Starter - Watch the first video below and take note of the synthesis within regarding what we have studied so far and potential future changes in our weather and climate.
Task 1a - Watch the video below (from BBC Newsnight) from September 2017. Explain what the mechanism is that fuels further hurricane development in the Atlantic Ocean and how climate change may contribute to an acceleration in this process. What are the counter arguments to this claim? |
|
|
|
|
What Does Climate Science Say?
Task 1b - Use the tab above to access your summary sheet to take notes on the information below.
So what does climate science tell us about the links between climate change and extreme weather and what impact is this likely to have on future events? Is science making progress on the attribution of any one extreme event to climate change?
Here is some of what we know:
Heat waves: It is no surprise that warming in the atmosphere leads to heat waves, or periods of very hot weather lasting days to weeks. In recent years, the frequency of heat waves has been increasing in many parts of the world, and the risk associated with extreme heat increases with further warming.
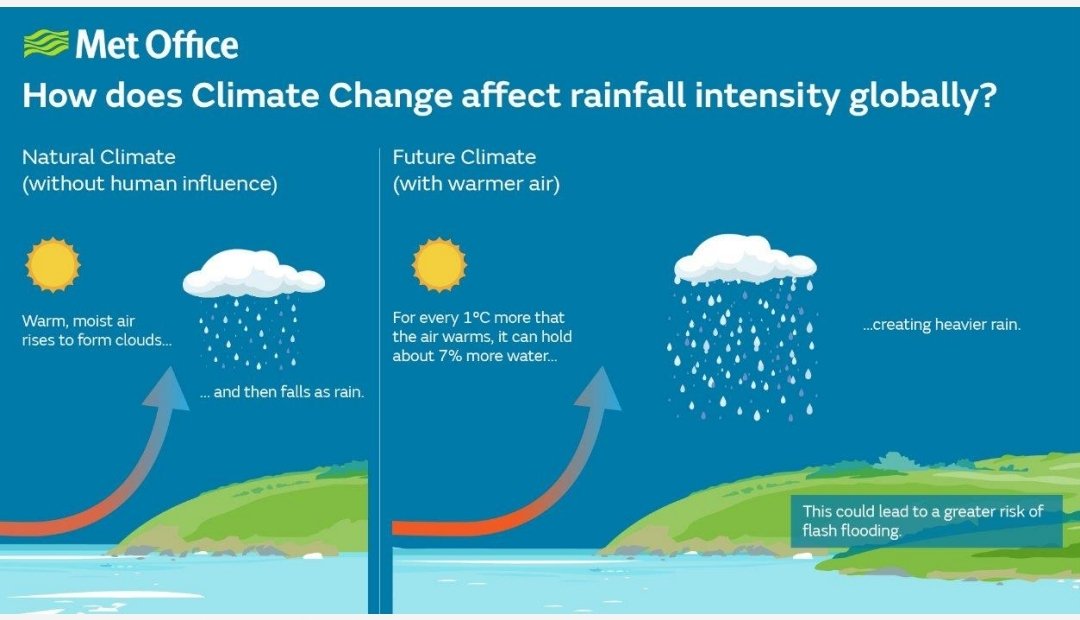
Storms and flooding: We also know that warming leads to higher sea levels, which in turn increases the risk of storm surge, contributing to the damage brought by hurricanes. Climate change also warms oceans, adding energy that can fuel coastal storms. Compounding this, a warmer atmosphere can hold more moisture, so there can be more moisture for storm systems, resulting in heavier rainfall. The U.S. National Climate Assessment finds that there has been a substantial increase – in intensity, frequency, and duration as well as the number of strongest (Category 4 and 5) storms – in Atlantic Ocean hurricanes since the early 1980s, linked in part to higher sea surface temperatures.
By late this century, models on average project a slight decrease in the number of tropical cyclones each year, but an increase in the number of the strongest (Category 4 and 5) hurricanes and greater rainfall rates in hurricanes (increases of about 20 percent averaged near the center of hurricanes).
Fires: We know that higher temperatures lead to increased rates of evaporation, leading to rapid drying of soils. This can not only contribute to drought conditions but can stoke forest fires. The U.S. National Climate Assessment finds that in the western forests, large and intense fires are projected to occur more frequently, with large and longer wildfires given higher temperatures and earlier spring snowmelt.
These trends in extreme weather events are accompanied by longer-term changes as well, including surface and ocean temperature increase over recent decades, snow and ice cover decrease and sea level rise.
Source: http://www.wri.org/blog/2017/09/extreme-weather-whats-climate-change-got-do-it
Task 1b - Use the tab above to access your summary sheet to take notes on the information below.
So what does climate science tell us about the links between climate change and extreme weather and what impact is this likely to have on future events? Is science making progress on the attribution of any one extreme event to climate change?
Here is some of what we know:
Heat waves: It is no surprise that warming in the atmosphere leads to heat waves, or periods of very hot weather lasting days to weeks. In recent years, the frequency of heat waves has been increasing in many parts of the world, and the risk associated with extreme heat increases with further warming.
Storms and flooding: We also know that warming leads to higher sea levels, which in turn increases the risk of storm surge, contributing to the damage brought by hurricanes. Climate change also warms oceans, adding energy that can fuel coastal storms. Compounding this, a warmer atmosphere can hold more moisture, so there can be more moisture for storm systems, resulting in heavier rainfall. The U.S. National Climate Assessment finds that there has been a substantial increase – in intensity, frequency, and duration as well as the number of strongest (Category 4 and 5) storms – in Atlantic Ocean hurricanes since the early 1980s, linked in part to higher sea surface temperatures.
By late this century, models on average project a slight decrease in the number of tropical cyclones each year, but an increase in the number of the strongest (Category 4 and 5) hurricanes and greater rainfall rates in hurricanes (increases of about 20 percent averaged near the center of hurricanes).
Fires: We know that higher temperatures lead to increased rates of evaporation, leading to rapid drying of soils. This can not only contribute to drought conditions but can stoke forest fires. The U.S. National Climate Assessment finds that in the western forests, large and intense fires are projected to occur more frequently, with large and longer wildfires given higher temperatures and earlier spring snowmelt.
These trends in extreme weather events are accompanied by longer-term changes as well, including surface and ocean temperature increase over recent decades, snow and ice cover decrease and sea level rise.
Source: http://www.wri.org/blog/2017/09/extreme-weather-whats-climate-change-got-do-it
Task 2 - Watch the series of short videos below (note that LIC / MIC / HIC impact) and outline how climate change may be attributed to an increase in severity and number of droughts around the world.
Record your notes for the first three videos on the A3 note taking framework below. The fourth video is optional and will give you a wider overview of the situation in the Sahel region of Africa.
You should also refer to this real-time map that shows global distribution of severity of drought events.
|
|
|
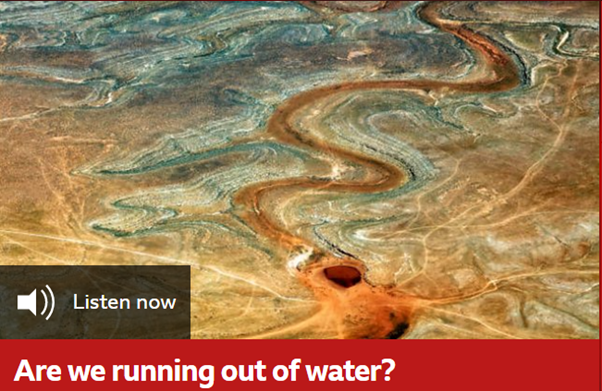
Task 3 - Time to get comfortable and spend 23 minutes listening to this particularly excellent BBC Inquiry episode.
"We cannot survive without water. But for a quarter of the world’s population, there just isn’t enough. The most vulnerable are those with the least access, and even if there is enough, it’s often in the wrong place".
There is a huge amount of synthesis in this episode that covers large parts of the IBDP Geography course. How many of them can you spot? Listen to the podcast and complete the quote and 100 word summary tasks. Click the image below to access the podcast.
Climate Change & ...spatial changes in biomes, habitats and animal migration patterns
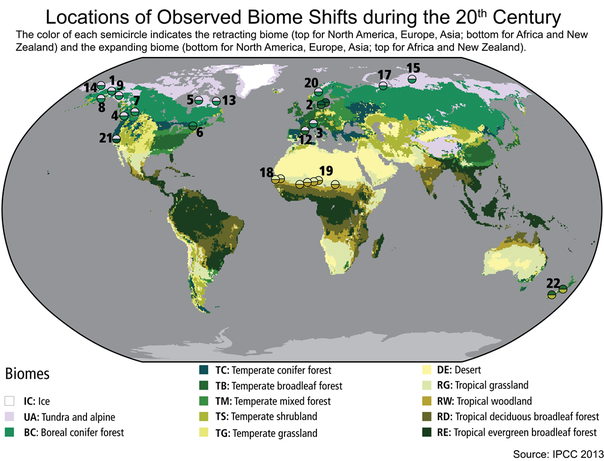
Spatial Changes in Biomes
A changing global climate threatens species and ecosystems. The distribution of species is largely determined by climate, as is the distribution of ecosystems and plant vegetation zones (biomes). Climate change may simply shift these distributions, but often, barriers and human presence will provide no opportunity for distributional shifts. For these reasons, some species and ecosystems are likely to be eliminated by climate change.
If significant climate change occur many natural populations of wild organisms will be unable to exist within their natural ranges. Changes in temperature and precipitation, and resultant changes in vegetation and habitat, are likely to seriously affect the suitability of the locales where species are presently found. Thus, climate change is an additional factor threatening the survival of species
Climate changes are happening very fast, within decades, and organisms change slowly, over many generations through evolutionary adaptation. All they can do to adapt to fast change is to move. Their moves are:
Tundra Turning Green
Using this printed article and this follow up too, highlight the major links to climate change and look for any further synthesis opportunities as well as links to the Sustainable Development Goals.
Further Reading Required? - This is a good Guardian Online article to start your search from.
Task 1 - Make notes on the first section of the note taking worksheet using the 4P's approach.
A changing global climate threatens species and ecosystems. The distribution of species is largely determined by climate, as is the distribution of ecosystems and plant vegetation zones (biomes). Climate change may simply shift these distributions, but often, barriers and human presence will provide no opportunity for distributional shifts. For these reasons, some species and ecosystems are likely to be eliminated by climate change.
If significant climate change occur many natural populations of wild organisms will be unable to exist within their natural ranges. Changes in temperature and precipitation, and resultant changes in vegetation and habitat, are likely to seriously affect the suitability of the locales where species are presently found. Thus, climate change is an additional factor threatening the survival of species
Climate changes are happening very fast, within decades, and organisms change slowly, over many generations through evolutionary adaptation. All they can do to adapt to fast change is to move. Their moves are:
- towards the poles where it is cooler;
- higher up mountains where it is cooler;
- towards the equator where it is wetter
Tundra Turning Green
Using this printed article and this follow up too, highlight the major links to climate change and look for any further synthesis opportunities as well as links to the Sustainable Development Goals.
Further Reading Required? - This is a good Guardian Online article to start your search from.
Task 1 - Make notes on the first section of the note taking worksheet using the 4P's approach.
Spatial Changes in Habitats
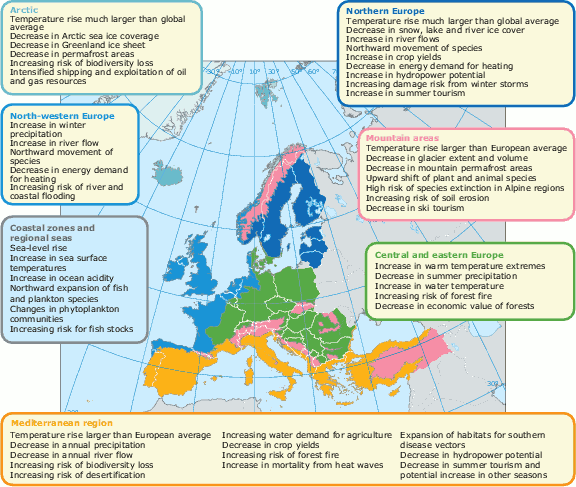
Source: https://ec.europa.eu/clima/policies/adaptation/how/territorial_en
Task 2 - Using the graphic above (Europe centred) (and the Guardian Online article in the last task and this excellent Guardian article too), take notes (on the worksheet) about the specific changing habitats brought about by climate change.
For students with a good command of French, you might want to look at this case study (in French) and this news report and video on the same theme.
Migratory Patterns of Animals
The amazing maps below were compiled by cartographer and analyst Dan Majka who brought this data to life in a series of maps that show what corridors mammals, amphibians, and other animals will use as they move to new habitats under projected climate change. Inspired by wind maps of the United States, and using code from Earth global wind map, adapted by Chris Helm, Majka’s dynamic map allows scientists and the public to see the continent-wide impact of climate change on animals and visualize corridors they will need to move.
You can see the full site by clicking here.
Task 3 - Complete the final note taking task on the worksheet.

|
|
Task 4 - Using the space provided on the worksheet, describe the movements on either of the two maps above and try to use prior knowledge to explain that movement in particular thinking about:
* where the largest corridors of movement seem to be concentrated
* the general direction of movement and linking in to the map showing shifting biomes in the previous lesson.
* where the largest corridors of movement seem to be concentrated
* the general direction of movement and linking in to the map showing shifting biomes in the previous lesson.
Global Climate Change & ... changes to agriculture, including limits of cultivation, crop yield & soil erosion.
Part 1 - Limits of Cultivation
To complete this section, we are going to be completing a creative task looking at viticulture and the potential future impacts of climate change on where wine grapes are grown.
To do this, you will be working in four teams. Follow the tasks below to complete the activity:
Task 1 - Download and print out in A3 format the future wine map on page 1 of the document below. The key on page 2 should be printed in A4. Stick this into the centre of a piece of A2 display card with the title 'How Climate Change Impacts Wine'.
Task 2 - Now click on the second tab below to access a New York Times article from 2019 on the impacts of Climate Change on the wine industry.
Task 3 - In your groups, read through the article and identify the FIVE chapters. They are as follows:
Chapter 1 - The Wine Map is Expanding
Chapter 2 - Wine Makers are Seeking Higher Ground
Chapter 3 - Growers are Curtailing Sunlight
Chapter 4 - Regions are Considering Different Grapes
Chapter 5 - Weather is No Longer as Predictable
* - If the link above does not work, you can access a PDF copy of the article here.
Each person should take a chapter or two, and choose a colour marker pen / felt. They should read their chapter carefully and make notes on their A2 display close of the countries mentioned using their chosen colour. The 4P's format would be particularly suitable here.
Make sure that you make a key to show what each colour of text represents (i.e. the chapters above).
Resource Wall
Task 4 - The Wine Bottle Challenge
Your individual group members are now going to choose a different future wine growing region (see map on A2 display) and then use Google Maps to research the area in a little more detail.
Your task is to individually create your own wine brand, utilising the name of the region, the type of grape and a description of the wine including the clever use of terms associated with climate change.
Your design challenge is to create an eye catching front and rear facing label for your empty bottle of wine that shows how the limits of cultivation have changed and how wine of the future may come from places that may be surprising!
Part 2 - Crop Yield
Scroll down below to read the OECD report on the issues faced by the agricultural sector linked to Global Climate Change.
Task 1 - Complete a piece of synthesis by using the worksheet below in conjunction with the information embedded as well as other resources in this unit, links to the SDGs etc.
Scroll down below to read the OECD report on the issues faced by the agricultural sector linked to Global Climate Change.
Task 1 - Complete a piece of synthesis by using the worksheet below in conjunction with the information embedded as well as other resources in this unit, links to the SDGs etc.
Download link for document above - here
|
Part 3 - Soil Erosion
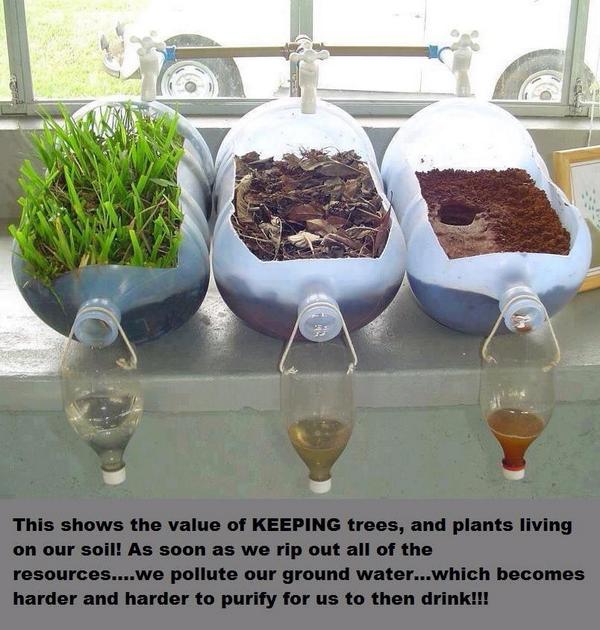
Starter: Collect some soil in a tub and ask students to rub a small amount into the worksheet to the right. Then write down everything that they know about soil in the space provided. Complete Task 1 - 4 below, on the worksheet to the right. Task 1 - Watch the the video to the right hand side (different languages here). Make notes on the following on your starter sheet: a. Outline then main importance of soil. b. How is soil formed? c. How long does it take to form 10cm of soil? d. How does human activity affect soil erosion? e. How many tonnes were lost in 2011 & what does that equate to in cost per person and annually to the global economy? f. How is fertile land being 'grabbed' from potentially vulnerable populations? g. Why is the issue of soil degradation not "current news"? Task 2 - Study the Soil Degradation map below carefully. Answer this IB 5 mark (target 10 minutes) question: Describe the distribution of global supplies of stable soil and comment on its suitability for future population use. 
Click to enlarge
|
|
Soil and climate change
Watch the first video below to now get a more full view of soil erosion linked to population growth, intensive agricultural activity and carbon storage.
Watch the first video below to now get a more full view of soil erosion linked to population growth, intensive agricultural activity and carbon storage.
|
|
|
|
Task 3 - Now watch the second video and make notes on how atmospheric carbon can be transferred back into the soil (flux).
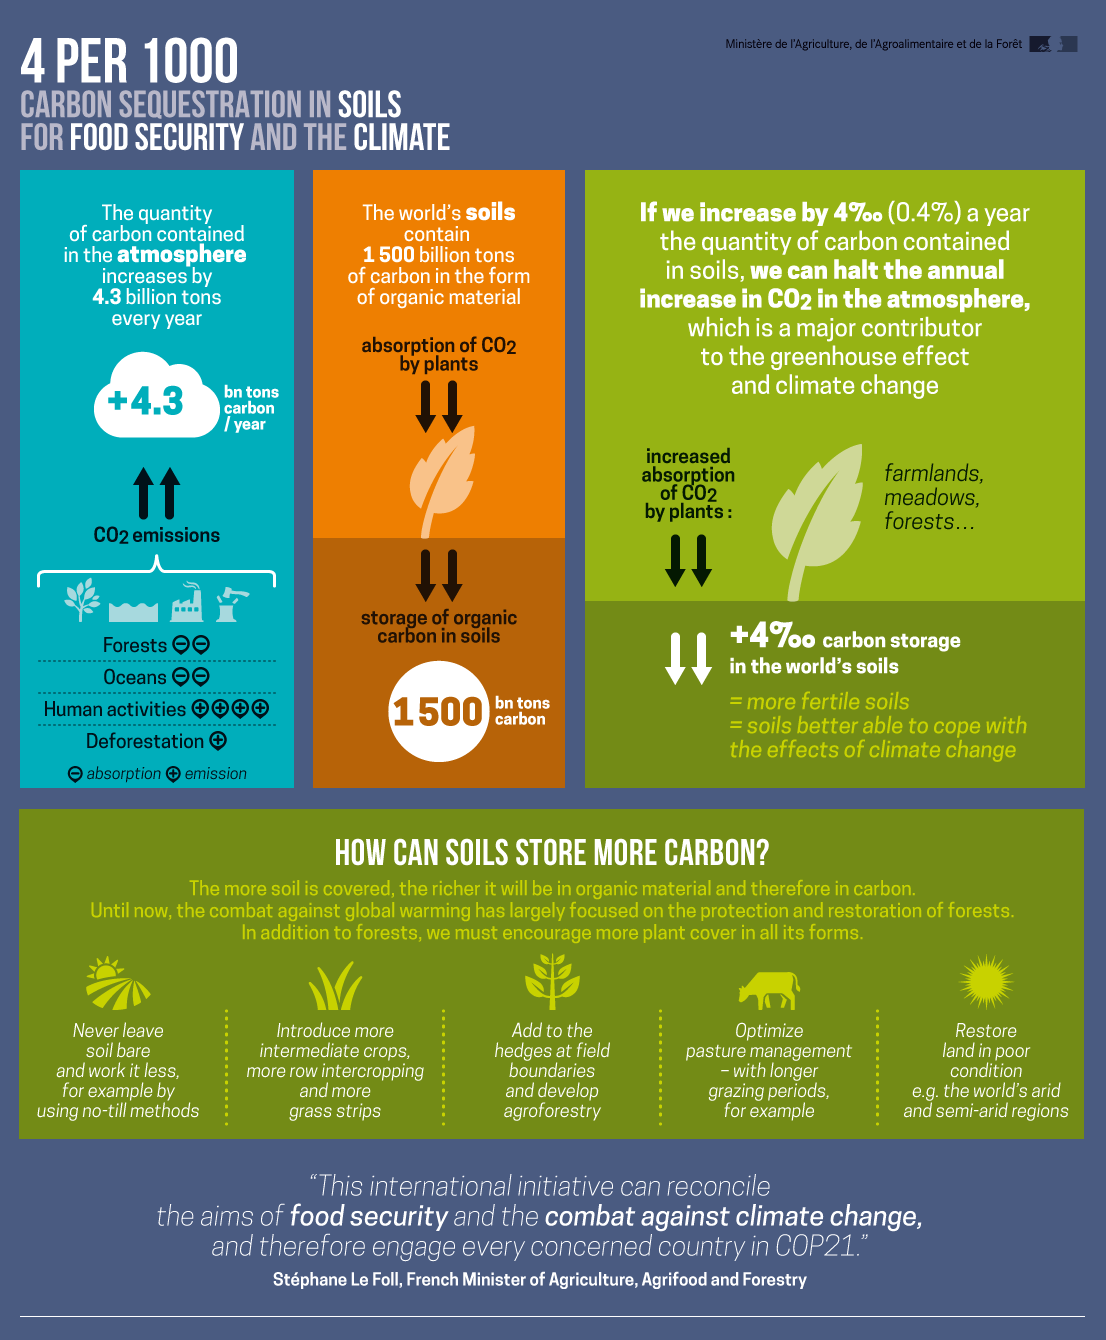
Task 4 - Now study this website and the video below that explains the '4 pour 1000' French government initiative. Create a 4 section revision grid and research and extract the four elements of place, possibility, power and process as contained on the site front page. |
|
Climate Change & Impacts on Health....
Task 1 - Use the worksheet above to take some brief notes from the video and this WHO article on the likely health hazards that humans will face resulting from climate change.
Climate Change & Migration (Bangladesh)...
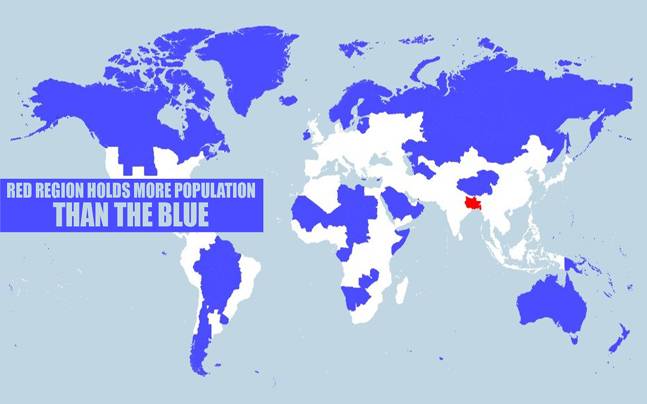
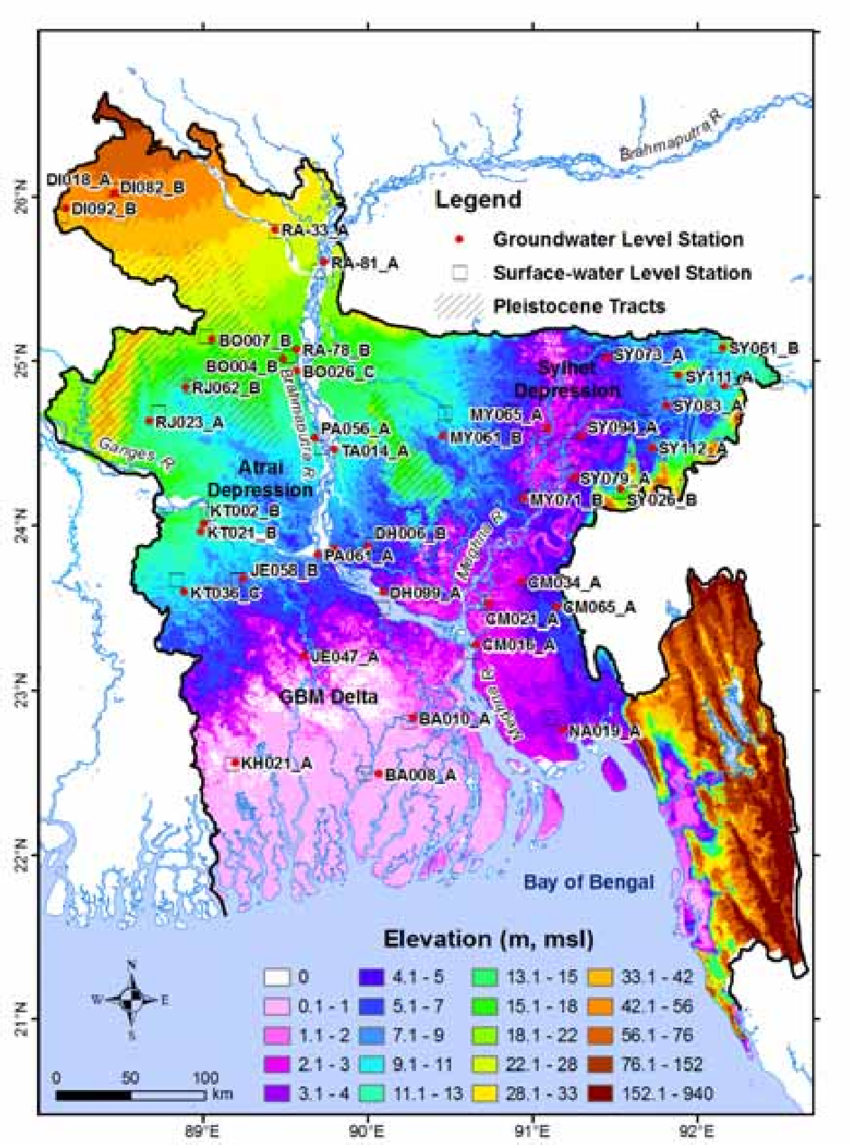
Starter: You will be working in groups of three to complete a map from memory exercise to introduce you to the Geography of Bangladesh. You each take it in turn to come to the front where you will see an A3 sized completed map of Bangladesh. All you have to do is remember what is on there in the 1 minute you have available and then go back to your table and draw it on to your A3 blank map. Remember, no communication with the people at the front. You will have one go each and it is up to the teacher if you get to go again.
Mapping From Memory Sheet
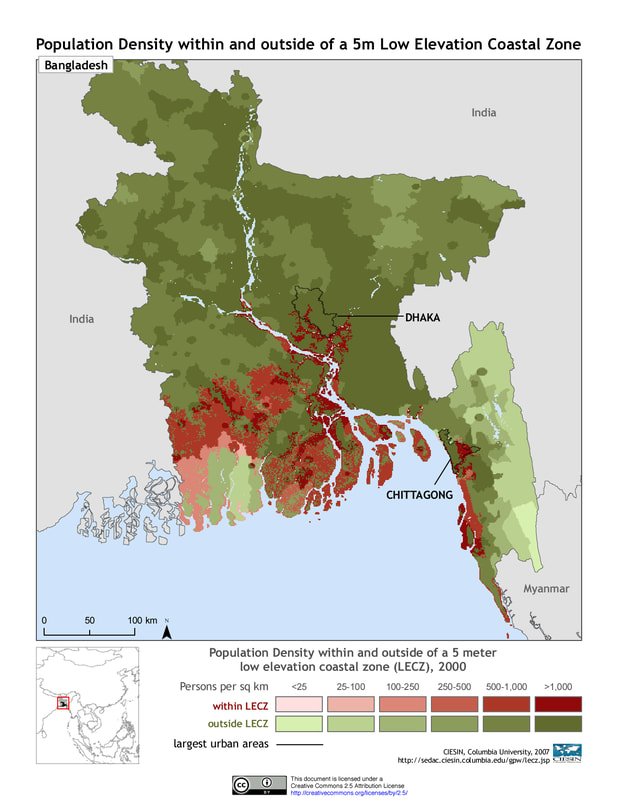
Task 1 - Using both of the excellent interactive sites below, work on your own to produce a personalised revision resource to show the impact of climate change on the vulnerable populations in Bangladesh. You may wish to use the Framework sheet above to complete the task as an annotated flow chart.
Your finished resource should aim to address the issues highlighted in Bangladesh as well as prior knowledge gained from this unit of work together with links to the 4P's & the SDGs.
The right hand side of this mind map may of use to you in terms of gathering key data.
Extension - The following December 2020 excellent BBC resource is great for extending your understanding and noting some of the ways in which Bangladesh is aiming to mitigate and adapt to their increasingly destructive flood events.
|
|
|