
What you'll need to know...
KEY CONCEPT - How physical and human factors shape places into sites of leisure
Human and physical factors explaining the growth of rural and urban tourism hotspots including the role of primary and secondary touristic resources
Variations in sphere of influence for different kinds of sporting and touristic facility, including neighbourhood parks and gyms, city stadiums and national parks
Factors affecting the geography of a national sports league, including the location and hierarchy of its teams and the distribution of supporters
Large-scale sporting, musical, cultural or religious festivals as temporary sites of leisure and their associated costs and benefits
KEY CONCEPT - How physical and human factors shape places into sites of leisure
Human and physical factors explaining the growth of rural and urban tourism hotspots including the role of primary and secondary touristic resources
Variations in sphere of influence for different kinds of sporting and touristic facility, including neighbourhood parks and gyms, city stadiums and national parks
Factors affecting the geography of a national sports league, including the location and hierarchy of its teams and the distribution of supporters
- Case study of one national sports league
Large-scale sporting, musical, cultural or religious festivals as temporary sites of leisure and their associated costs and benefits
- Case study of one festival in a rural location, its site factors and geographic impacts
What Are Tourist Hotspots?...
|
|
|
|
 Source: http://cdn.visualinformation.info/
Complete the following activities on the worksheet above.
Starter: Watch the three videos above in order. Discuss why Venice attracts so many tourists and the impacts that this is having on the city.
Background
The last piece of work in the previous unit demonstrated that tourism and sport can be influenced by a number of physical and human factors.
Physical - Rainforests, mountain ranges, deserts, polar areas, rivers and coasts, climate (hot, dry, cold etc.)
Human - Food & drink, customs and traditions, religion, sporting events, theme parks, architecture etc.
You also saw how tourism can be impacted by global events such as a recession, terror attacks or political instability.
Task 1 - Study the map to the right (click to enlarge). It show the 50 most population tourist destinations around the world.
i. Rank order the thee most visited cities according to this map.
i. What tourism resource (see key) often attracts the highest number of people?
iii. State the three most visited 'resources' in the category above.
iv. State one weakness of the infographic map below.
Task 2 - Using this website, complete the following tasks:
i. Define a 'Tourist Hotspot'
ii. State the three desirable factors for hotspot creation.
iii. Define and give an example of a seasonal hotspot
iv. Define and give an example of a diurnal hotspot.
Task 3 - Where was the last tourist hotpot you visited? How do you know it was a hotspot?
Human & Physical Factors & Urban Tourism Hotspots...
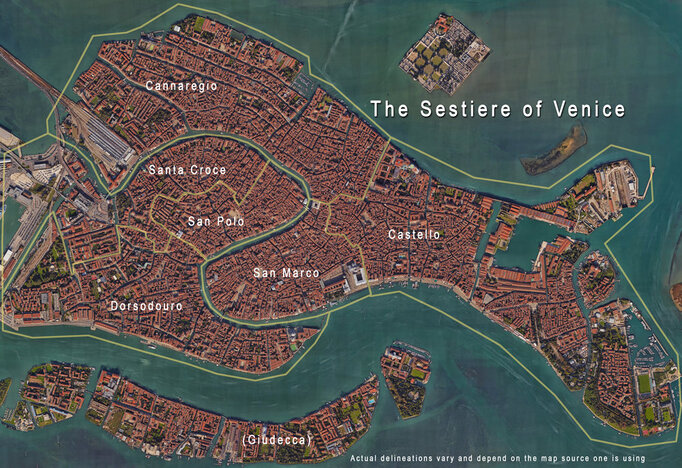
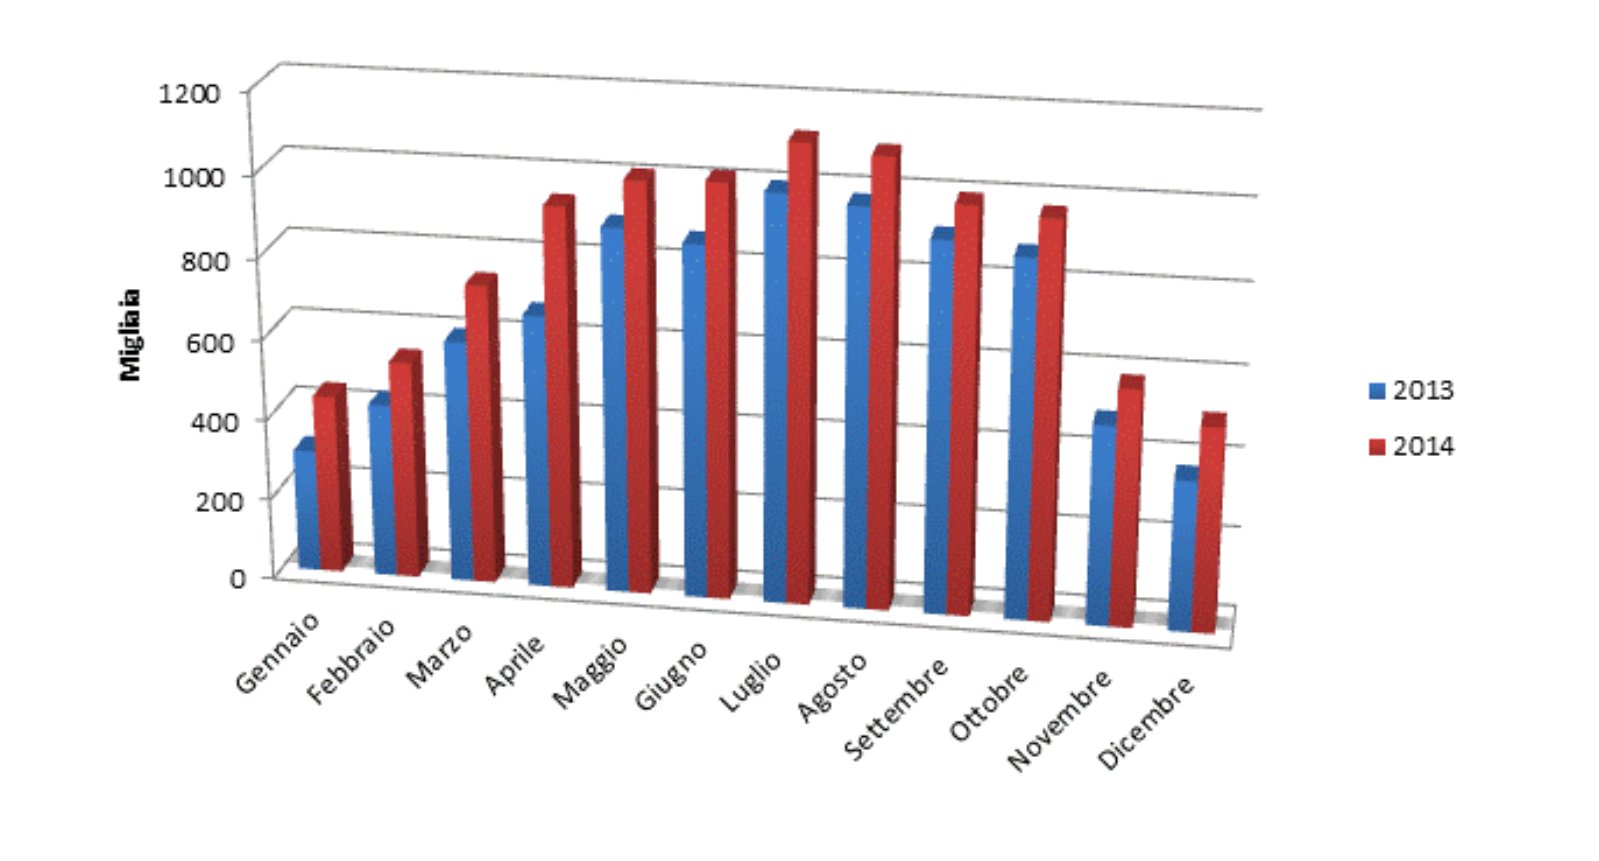
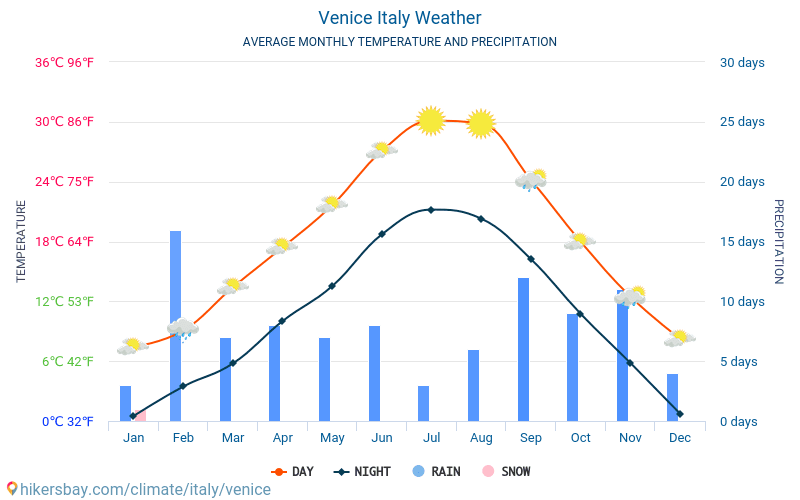
The resource wall below contains data and information that you can use to build up your note taking sheet on the physical and human factors that have made Venice a tourist hotspot.
Task - Use the resources below and the note taking worksheet above to make notes of the human and physical factors that have made Venice a tourism hotspot. Include reference to primary & secondary tourism resources and study the map carefully for clues such as accessibility and transport routes.
Note
The YouTube video is a 360° video and so you are able to look around you as the video plays.
The visitor numbers bar chart is in Italian. The Y axis can be translated as 'thousands'.
Click on the satellite image to view the Google Map of Venice.
|
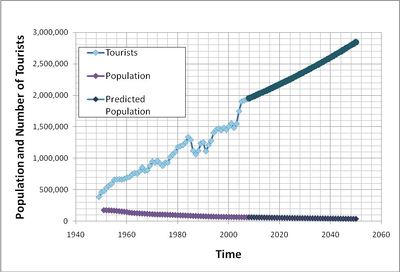
http://www.venipedia.org/wiki/index.php?title=Demographics
https://travel.stackexchange.com/questions/87736/venice-tourist-volume
|
Human & Physical Factors & Rural Tourism Hotspots...
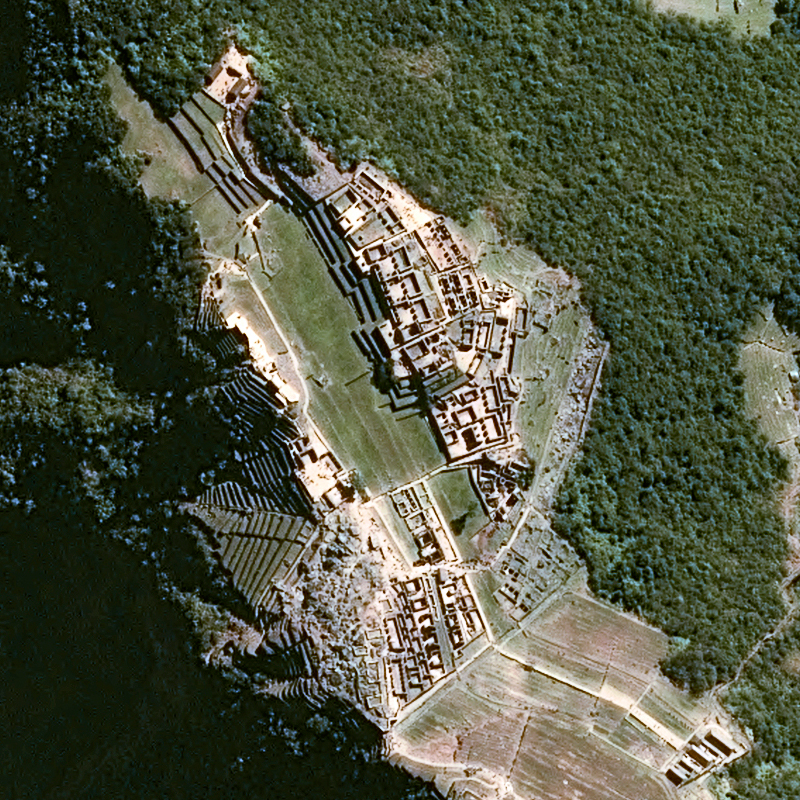
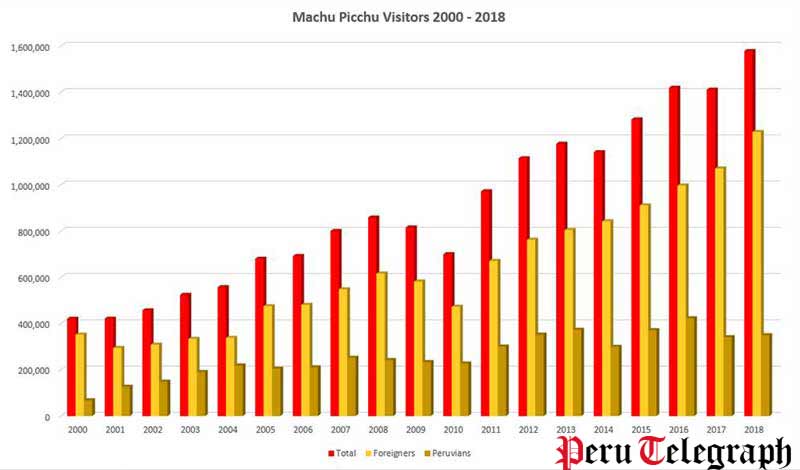
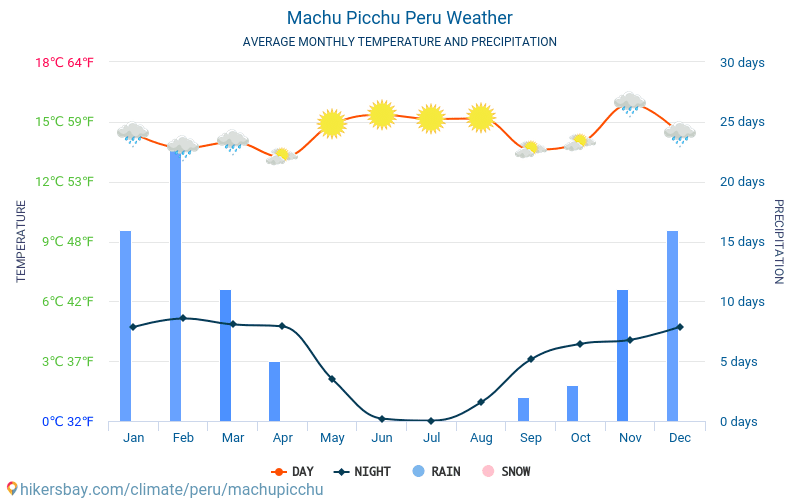
The resource wall below contains data and information that you can use to build up your note taking sheet on the physical and human factors that have made Machu Picchu a tourist hotspot.
Task - Use the resources below and the note taking worksheet above to make notes of the human and physical factors that have made Machu Picchu a tourism hotspot. Include reference to primary & secondary tourism resources and study the map carefully for clues such as accessibility and transport routes.
Note
The YouTube video is a 360° video and so you are able to look around you as the video plays.
Click on the satellite image to view the Google Map of Machu Picchu.
|

https://www.fertur-travel.com/blog
|
Variations In Sphere Of Influence (Tourist & Leisure Facilities)...
|
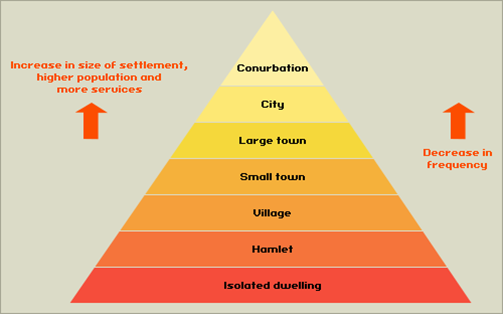
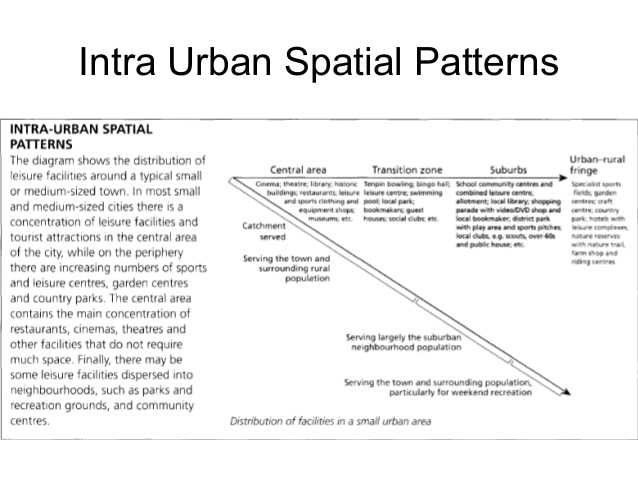
Please complete the following activities on the worksheet above. Starter: The key terms. Define: 1. Hierarchy 2. Sphere of Influence 3. Range (of a facility) Task 1 - Hierarchy Basics i. You may previously have learnt about 'settlement hierarchy'. This is a model that is worth revisiting to build our understanding of a the variations that exist in the sphere of influence for different kinds of sporting & touristic facilities. Using both the images to the right, complete the table on the worksheet. Task 2 - Explain how the following factors can impact on the position of facilities within the leisure hierarchy: i. importance ii. frequency iii. size/capacity Task 3 - Explain how the following factors can influence the number and quality of leisure, tourism and sporting fixtures in a settlement. i. Level of economic development ii. Accessibility iii. History / Culture iv. Climate v. National Events (e.g. Japan Olympics 2021). Task 4 - Spend 5 minutes reading the studying the model to the right hand side 'Intra-Urban Spatial Patterns'. Think about how this might be applied to your locality. |

|
Task 5 - We are going to apply what we have just learnt to your local town / city. Download the task sheet below and complete the activities set out.
Case Study of One National Sports League...

|
Case Study – Ligue 1, France. Ligue 1, officially known as Ligue 1 Uber Eats for sponsorship reasons, is a French professional league for men's association football clubs. Being the top of the French football league system, it is the country's primary football competition. Administered by the Ligue de Football Professionnel, Ligue 1 is contested by 18 clubs (as of the 2023–24 season) and operates on a system of promotion and relegation from and to Ligue 2. Complete this case study using the work pack below. |
|
Glastonbury & Its Site Factors & Geographic Impacts...
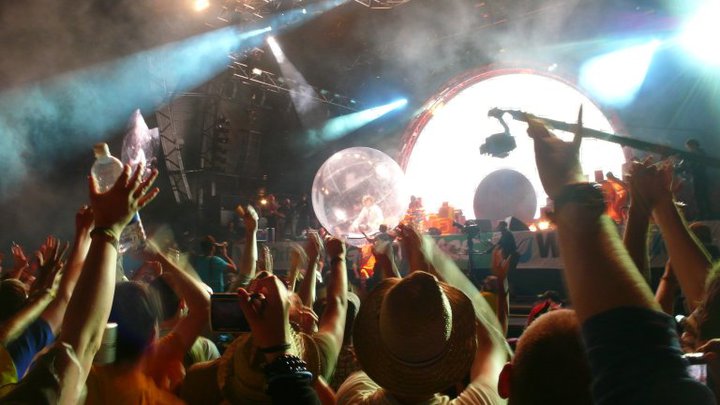
Image courtesy of my Uncle Dave!
The following tasks can be completed by using one of the work booklets (editable or printed) using the orange tabs below.
|
|
|
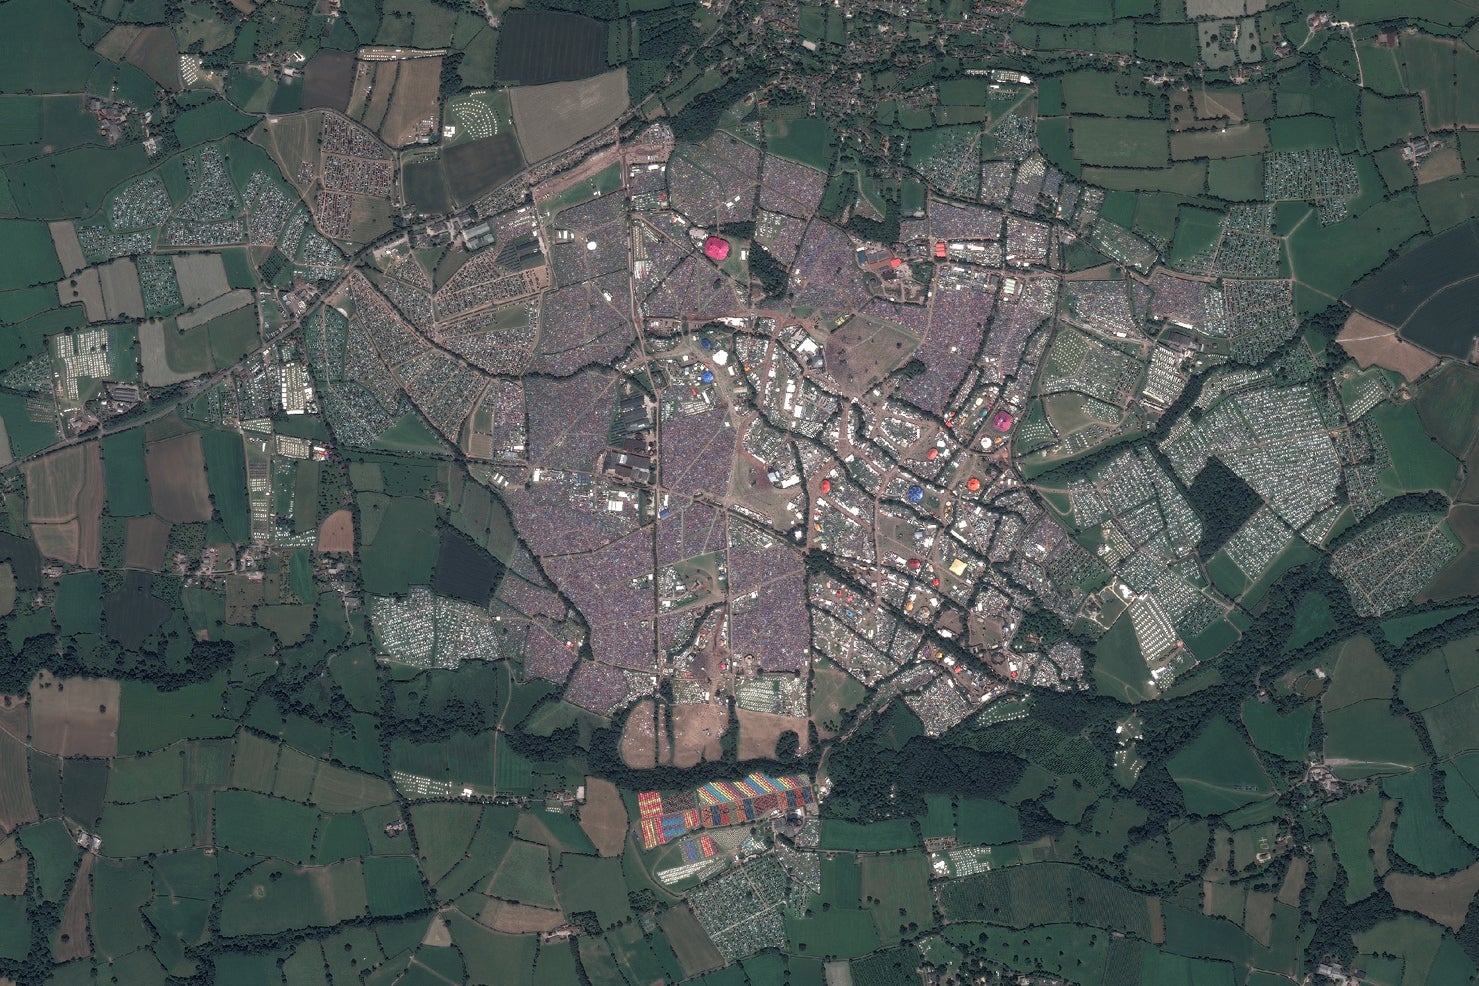
Starter: Study the embedded Google Map of the site of the Glastonbury Festival, UK. This world famous festival is held in a rural area in the south west of England, UK.
Compare the map to the satellite image on the right showing the festival in full swing. Adjust the map using the zoom tool so that you have the same comparison view.
Take a screen shot of both maps together and then add to your worksheet under the starter task.
Task 1 - Mapping & Site
Using Google maps, describe the siting factors of Worthy Farm, location of one of the worlds' biggest music festivals. Ensure that the following factors are covered:
a. Relief
b. Accessibility
c. Space
d. Possible Conflict (noise, congestion etc).
Task 2 - Scale Comparison
Use the orange tab below to access a mapping tool that will overlay the site of the Glastonbury Festival onto an area that you are familiar with to give you and idea of the scale.
Take a screen shot of the site overlay onto your home area and enter it into the relevant section of your work booklet. Comment on the spatial coverage of this temporary place.
Task 3 - History of the Festival
i. Watch the first video and make some notes on the settlement of Glastonbury (7 miles / 11km) from the festival site.
ii. Using the following two videos below, create a short history of the Glastonbury Festival outlining why 2020 should have been a special year for the festival (cancelled and rolled over to 2021 due to Covid-19).
iii. Give two examples of charities that have benefited from the Glastonbury festival.
Task 4 - My Top 5!
Using this link from the website (and presuming that you like music), what would your five top acts to go and see have been on the 2022 festival dates?
|
|
|
|
Task 5 - Before & After
Study both videos below. Both are filmed by the same person before and after the Glastonbury Festival in 2016. Write a 150 commentary on the environmental impacts of the festival on the landscape.
*Bonus points - what are the strange shapes on the fields on the 'after' video?
|
|
|
Task 6 - Sustainable Glastonbury?
Check out the following resources from the Glastonbury Website:
1. Energy Policy
2. Ecological Policy
For each of the policies above, cut and paste four pieces of key text into your social, economic and environmental fact boxes.
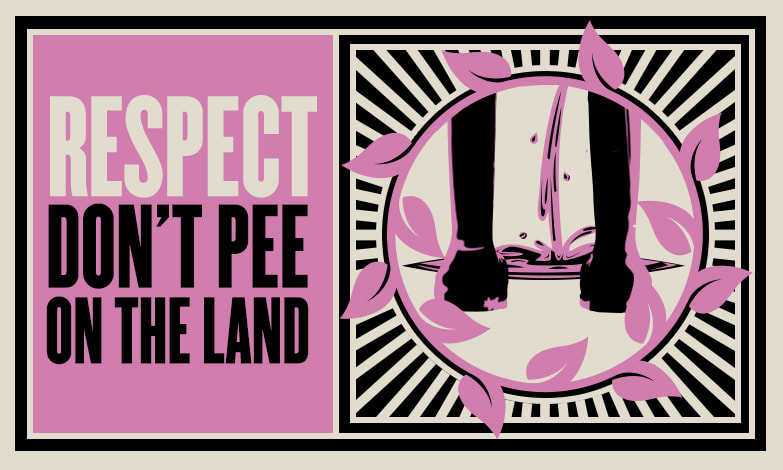
Task 7 - Reduce, Respect, Reuse.
Using the three schemes below (click on the image to access further information): Update September 2021 - Drugs in the River
a. Identify the geographic impacts that each of the campaigns aim to reduce.
b. Take notes on how the scheme has been implemented using the 4P's approach.
c. Evaluate (A03) each of the three strategies aimed at reducing your identified geographic impact.
For 'Reduce - Take it, don't leave it' - see this image for the thousands of tents that have been left behind.

|
|

|
Task 8 - The Curse of The Car.
Many people choose to travel to Glastonbury each year by car or in camper vans. This is partly due to the rural location of the festival and that public transport cannot cope with the increased demand during the festival dates.
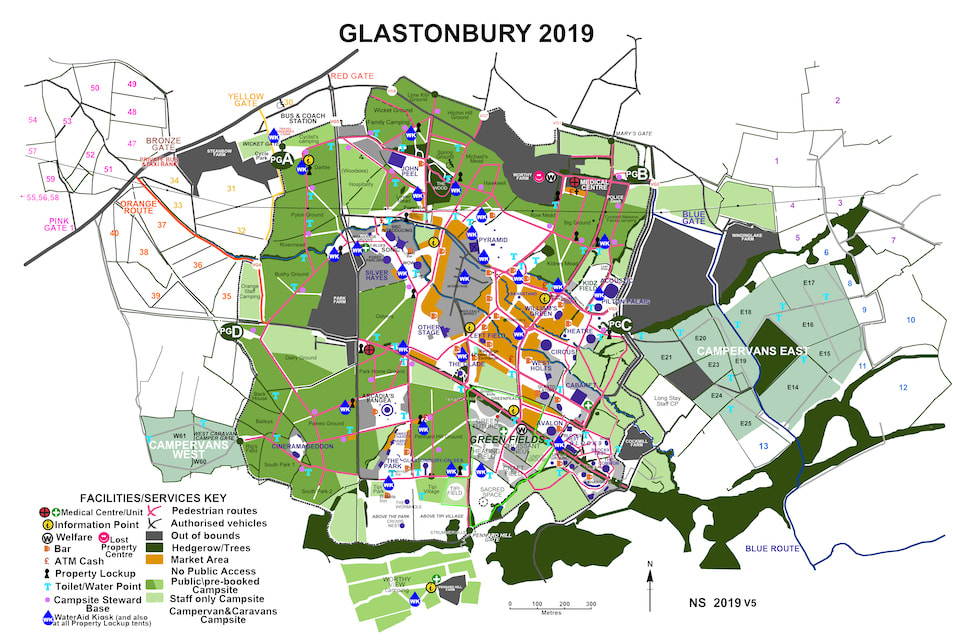
Study this map showing you all the car parks around the festival site for tens of thousands of cars.
Read this article from the NME about a proposed scheme to reduce congestion around the festival site.
Take notes on your work booklet.
Exam Corner - Paper 1 Essay Question
10. Examine the impact of one festival on the surrounding rural area. [10]