What you'll need to know...
KEY CONCEPT - The characteristics and distribution of urban places, populations and economic activities
Characteristics of urban places, including site, function, land use, hierarchy of settlement (including megacities) and growth process (planned or spontaneous)
Factors affecting the pattern of urban economic activities (retail, commercial, industrial), including physical factors, land values, proximity to a central business district (CBD) and planning
Factors affecting the pattern of residential areas within urban areas, including physical factors, land values, ethnicity and planning
The incidence of poverty, deprivation and informal activity (housing and industry) in urban areas at varying stages of development
Characteristics of urban places...
What does Wikipedia Say?
An urban area is a human settlement with high population density and infrastructure of built environment. Urban areas are created through urbanisation and are categorised by urban morphology as cities, towns, conurbations or suburbs. In urbanism, the term contrasts to rural areas such as villages and hamlets. The creation of early predecessors of urban areas during the urban revolution led to the creation of human civilisation with modern urban planning, which along with other human activities such as exploitation of natural resources leads to human impact on the environment.
The world's urban population in 1950 of just 746 million has increased to 3.9 billion in the decades since. In 2009, the number of people living in urban areas (3.42 billion) surpassed the number living in rural areas (3.41 billion) and since then the world has become more urban than rural. This was the first time that the majority of the world's population lived in a city. In 2022 there are 7.9 billion people living on the planet, of which the global urban population comprised 4.1 billion. The Population Division of the United Nations Department of Economic and Social Affairs at that time predicted the urban population would grow to 9.7 billion by 2050, with 37% of that growth to come from three countries: China, India and Nigeria.
Check out the short video below from UNICEF. The graphic depicts countries and territories with 2050 urban populations exceeding 100,000 people. Circles are scaled in proportion to urban population size. Key is as follows:
Purple - More than 75% urban population
Yellow - 50-75% urban population
Blue - 25-50%% urban population
Green - less than 25% urban population
Task 1 - Press play and watch the growth of these urban areas (note definition). Take screen shots of 1950, 2000 & 2050 and then complete a piece of written commentary about the historical and future growth of urban areas.
Task 2 - Using the World City Populations interactive guide here, take a screen shot of the graphic and comment of the location of urban areas around the world experiencing rapid population growth as well as issues relating to potential future climate change (unit 1) and population displacement.
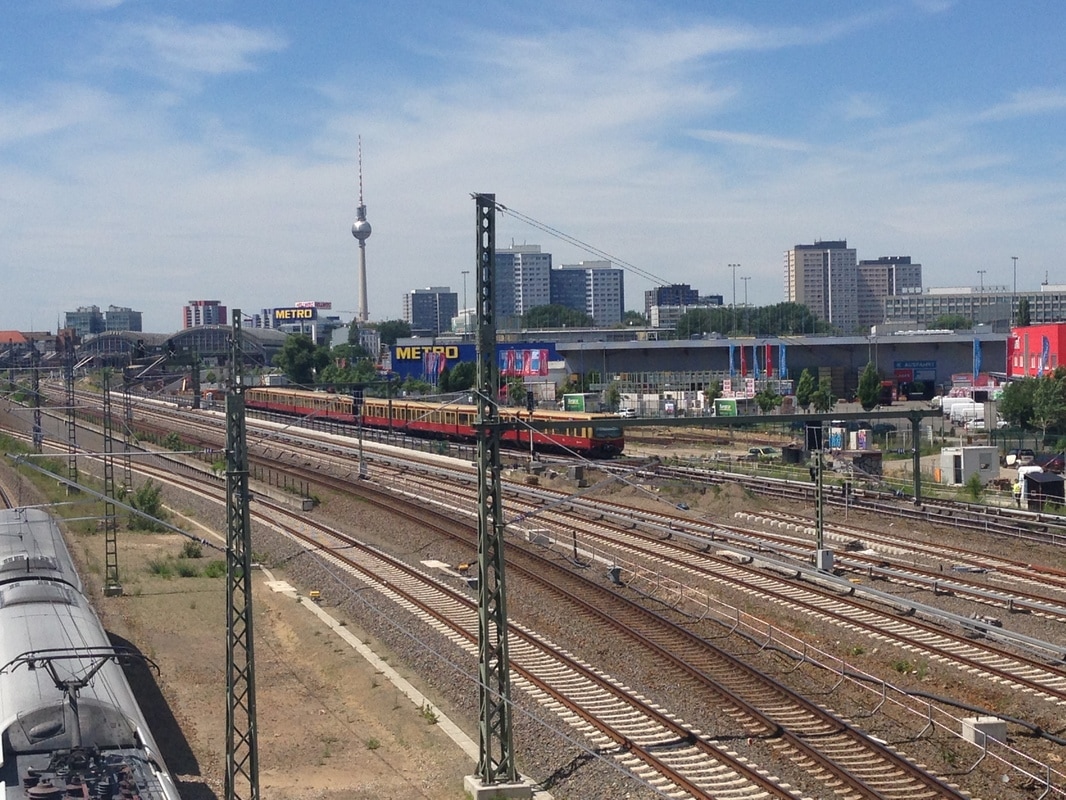
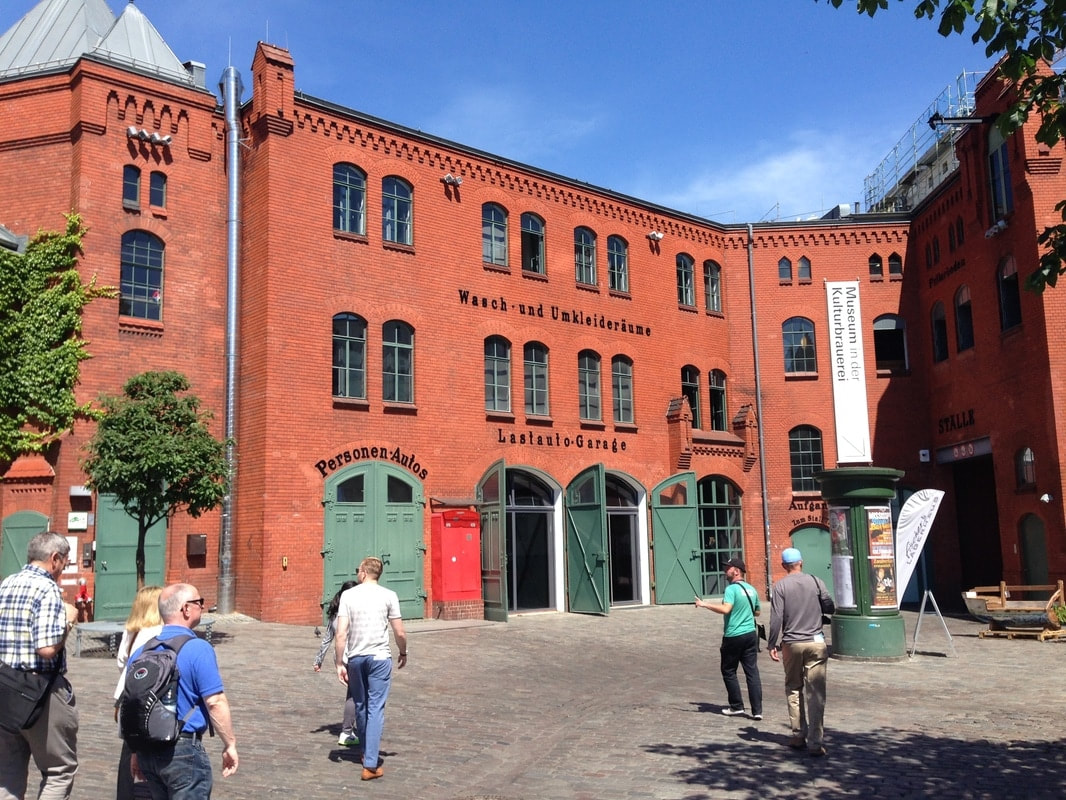
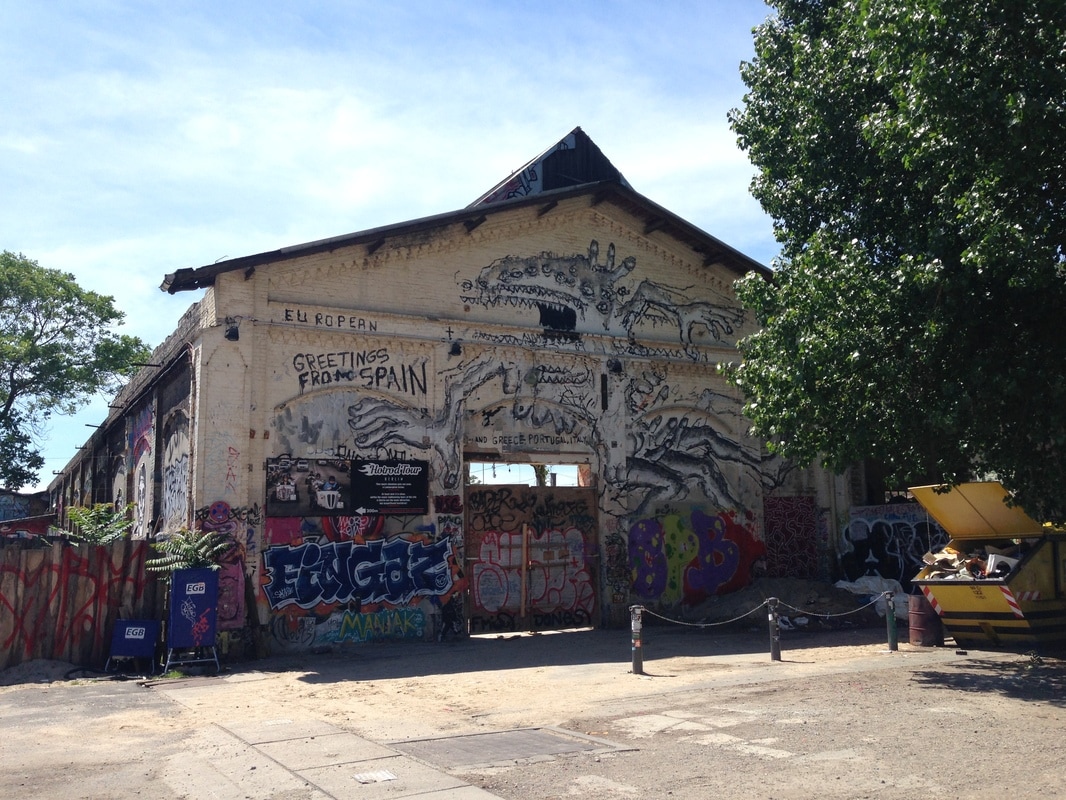
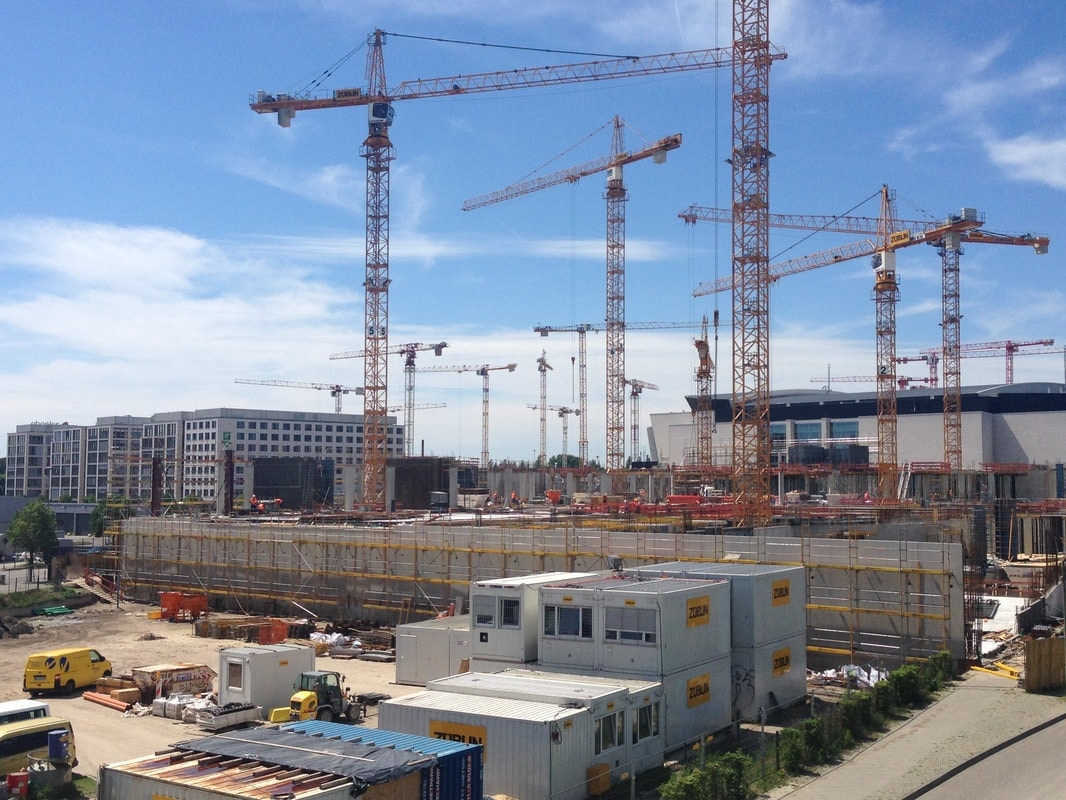
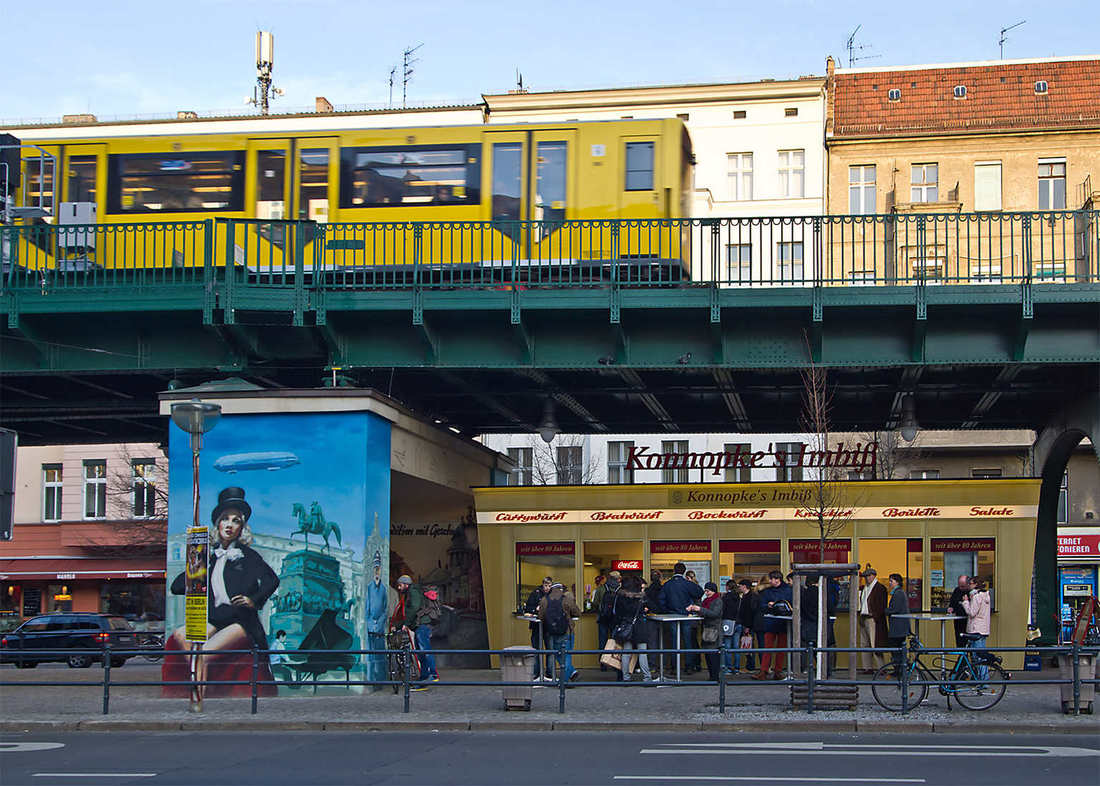
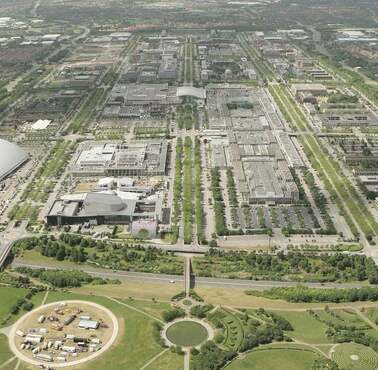
Urban environments like Berlin are diverse areas that have a multitude of modern days functions such as being the centre of business and commerce as well as home to millions of people. They have important roles to play in providing jobs and transport hubs as well as being major centres for the sports, leisure and tourism industries. Widespread urban renewal and processes of gentrification are changing the faces of the major cities around the world. Berlin is a very good example of an urban area that has undergone major change, for many different reasons and will be a focus in this unit of study.
Task 3 - Think about your city. What were its original functions and how have those functions changed in the modern day?
Alternatively, watch the video about Berlin beneath. Note five modern-day functions of the city.
Task 3 - Think about your city. What were its original functions and how have those functions changed in the modern day?
Alternatively, watch the video about Berlin beneath. Note five modern-day functions of the city.
Site, Function & Land Use... |
|
The site of a settlement is the land upon which it was built. There are a number of different factors that can determine the site of a settlement. These are:
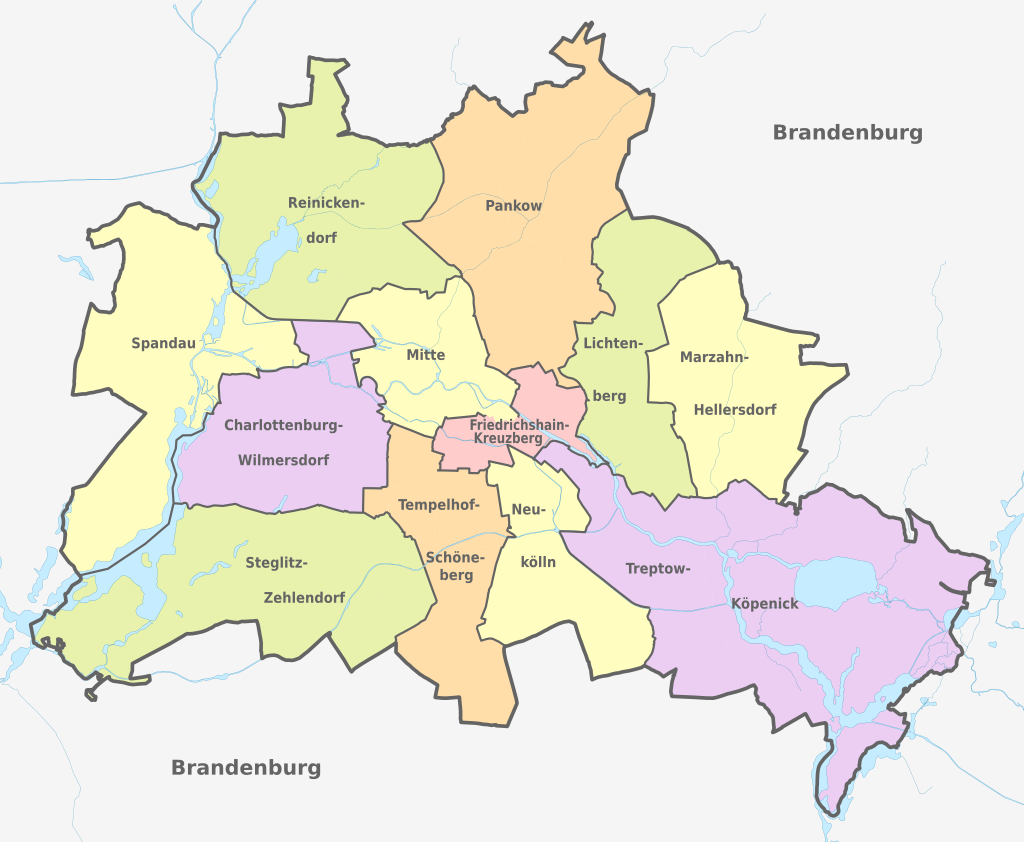
wet point site - these are sites close to a supply of water dry point site - these are sites that avoided the risk of flooding defensive site - these were sites that were on high ground and allowed the inhabitants to see enemies from a distance aspect - many settlements in the northern hemisphere are located on south facing sides of valleys where it is sunny shelter - away from rain and prevailing winds trading point - often settlements developed where natural training points meet such as along rivers or natural route ways resources - many settlements developed close to where natural resources could be found. Task 1 - Study the embedded Google map of Berlin as well the video to the right and try to identify which siting factors were responsible for the growth of Berlin. Complete your analysis on the worksheet. Click here to access a land use map of Berlin. Study it carefully. The legend is in German but you can use this English translation sheet to help you decipher the land uses. You may also consult the PDF land use map to the right in the blue tab. Task 2 - Use a copy of the map to completed an annotation exercise to describe the main land use patterns and functions in Berlin. Use the Borough map to the right to provide some context and from a historical point of view, you might want to have a look at this map. In your annotations, make reference to: Residential patterns Commercial patterns Retail Concentrations & identification of CBD. Green area distribution Try to incorporate the settlement factors at the top of this section where appropriate. Can you see any growth along arterial routes? |
|
The hierarchy of settlements...
|
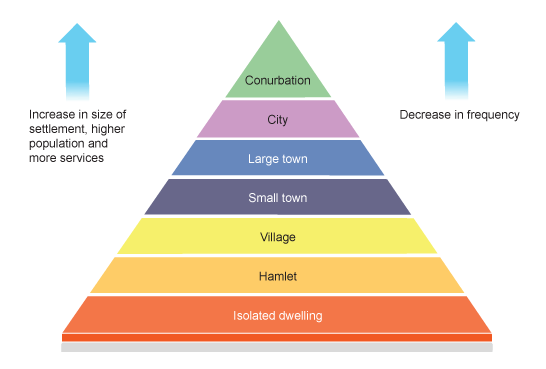
The word hierarchy means an order or an importance and can be applied to a variety of settings. Think about your school and how it works in that setting. Now think of government or a football team and you'll also see this hierarchy at work too.
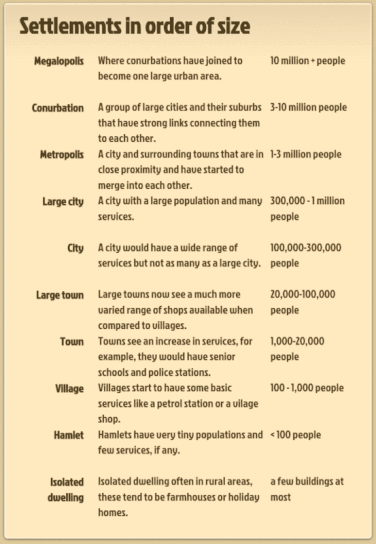
Task 1 - Match the following descriptions to the key term. ?? an area served by a settlement which can also be called its hinterland. ?? the absolute minimum number of people required to support a service and keep it in business? ?? the maximum distance that customers are prepared to travel to access a good or service. ?? convenience goods bought on a necessity basis and include items such as bread, milk or rice. ?? more luxurious or goods that are purchased on an infrequent basis and generally more costly such as tablet devices or cars. Range Sphere of influence High Order Goods Threshold Low Order Goods Task 2 - Create your own mind map / concept map that incorporates the hierarchy triangle with the information to the right. Task 3 - Now watch the video embedded beneath taking notes as you go. |
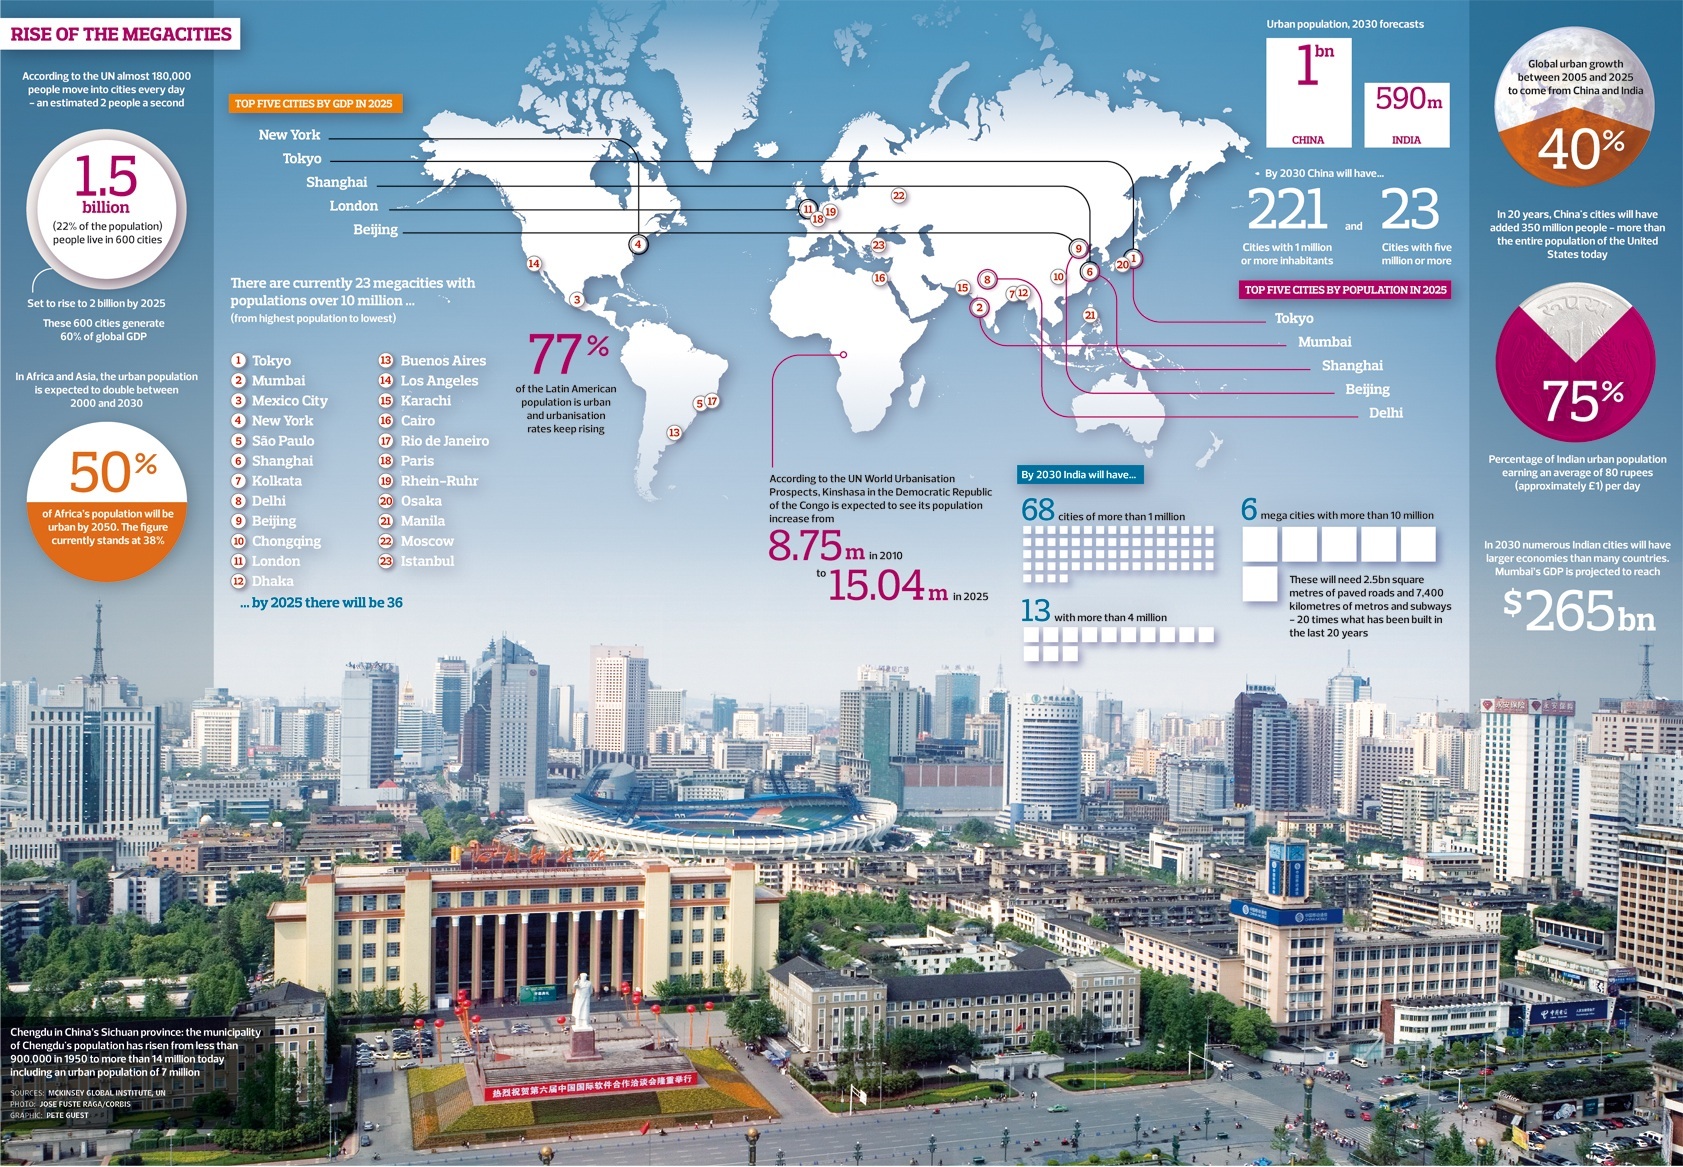
The Growth of Megacities...
|
Task 1 - Spend a little time exploring this Esri Story Map. Pay particular attention to the increase in size of spread of the megacities in the study. Task 2 - watch the video to the right hand side and take notes of the global patterns and trends associated with historical and future growth of megacities globally. Don't forget to make sure you know the reasons for growth. Case Study - Your focus for this piece of work in going to be Mumbai in India. You should watch the video to the right to get an idea of why the city has grown so quickly (note link to colonisation by the Portuguese) as well as modern day functions of industry, commerce and Bollywood. Task 3 - Open up GeoFile 696* (September 2013) - Mumbai: Case Study of a Megacity - and read over all the information within before completing the four questions on the back page. *To subscribe to GeoFile, please click on this link. It may be searchable online too. |
|
Spontaneous Settlement Growth...
Large and successful settlements have developed because of a number of favourable factors that have allowed the settlement to grow, prosper and in turn attract more people to the area. At the start of this unit, we looked at the original siting factors for settlements and how some places will never support more than a handful of houses (hamlet) whereas others have grown into megacities (Tokyo/Yokohama).
Environments that have traditionally encourage settlement growth are located close to the sea (trade, exploration) and in temperate deciduous areas (annual leaf fall leading to good quality soil and therefore productive agriculture). They may have good links with inland areas too enabling those areas to also develop. If you study the megacities map above once again, you will see the vast majority of these urban areas are located on the coast or at the very least, on a large river a short distance from the sea.
London, New York, Marseille, Adelaide, Rio de Janeiro, Beijing, Mumbai - all located on coastal areas and allowed access to inland areas (perhaps with the exception of Australian cities due to the significant climatic challenges faced inland!). This can be seen using Gould's Spatial Exploration Model.
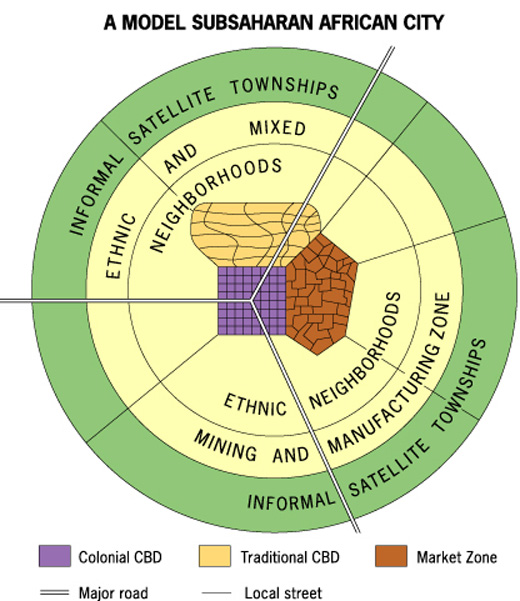
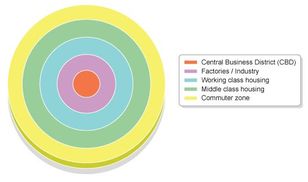
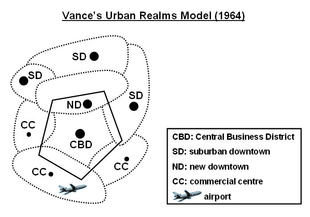
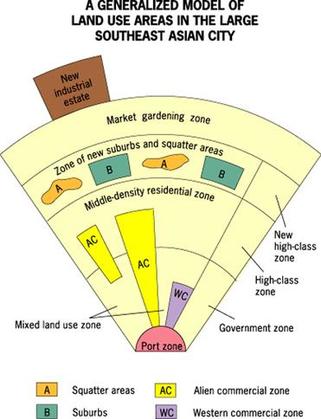
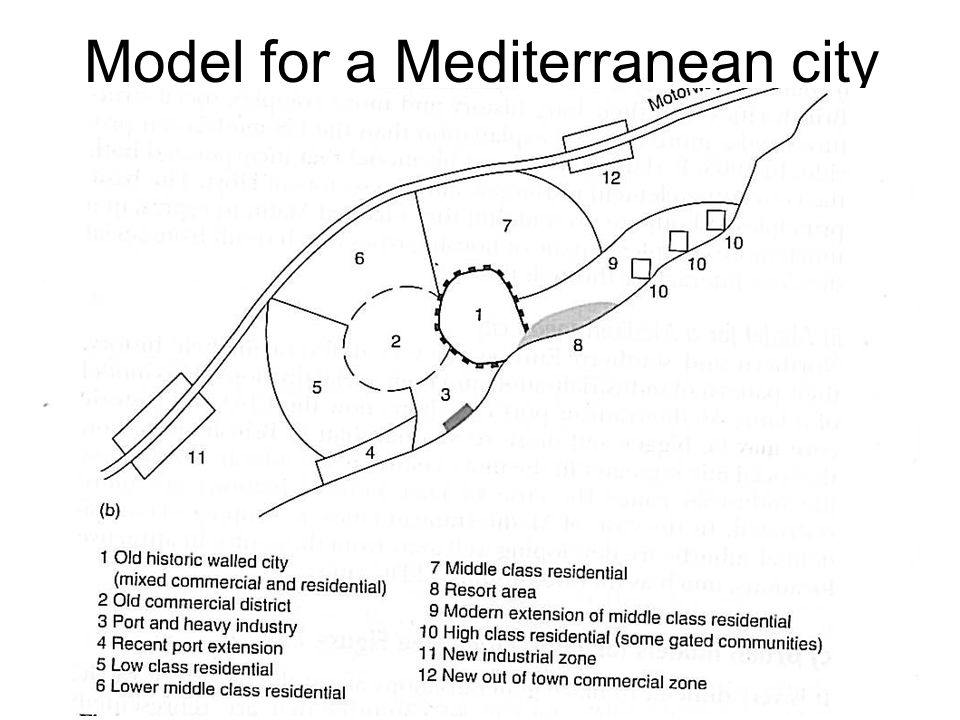
Task 1 - Below you will see a four examples of urban models that aim to show how urban areas have grown over time. You are probably familiar with the Burgess Model (UK based) but the other three may be new to you.
Compare and contrast the growth factors in the four models. Note: Vance's model is for the United States. Click on each of the images to enlarge. You can use the worksheet below to record your thoughts.
Task 2 - Click on each of the four tabs below to open up a maps of Berlin, Germany. You will see that the extent of the city has grown hugely since 1925 and that growth was not equal between the East & West of the city in the years after the construction of the Berlin Wall.
Describe and explain the factors affecting the growth and future sustainability of one city that you have studied.
To do this, you must use screen shots of any of the two maps below
You should read this Forbes Article outlining the reasons for growth
You should read this DW.com Article explaining some of the issues with continued growth.
Planned Settlement Growth...
|
The concept of a planned city is more common than you might think. For the purposes of this study, we will be using Milton Keynes in the UK as the example, however, you can consult this Wikipedia list to see if there is a closer example to where you are in the world.
BBC Link here - Milton Keynes Article
In the 1960s, the UK Government decided that a further generation of new towns in the South East of England was needed to relieve housing congestion in London. Map to show location is here. Population trend of Borough and Urban Area 1801–2011 Since the 1950s, overspill housing for several London boroughs had been constructed in Bletchley. Further studies in the 1960s identified north Buckinghamshire as a possible site for a large new town, a new city, encompassing the existing towns of Bletchley, Stony Stratford and Wolverton. The New Town was to be the biggest yet, with a target population of 250,000, in a "designated area" of 88.4 km2. The name "Milton Keynes" was taken from the existing village of Milton Keynes on the site. On 23 January 1967, when the formal new town designation order was made, the area to be developed was largely farmland and undeveloped villages. The site was deliberately located equidistant from London, Birmingham, Leicester, Oxford and Cambridge with the intention that it would be self-sustaining and eventually become a major regional centre in its own right. Planning control was taken from elected local authorities and delegated to the Milton Keynes Development Corporation (MKDC). Task 1 - Using the information above and this article from 'Geographical' create a fact sheet that shows the reasons for development of this planned city and to what extent it has been successful?
|
|
Factors affecting the pattern of urban economic activity...
|
Land in an urban area can be broadly split up into commerce (retail), industry and residential. The value of the land is associated with these uses as well as the proximity to the Central Business District (CBD).
Land prices generally decrease as you move away from the most central area of a city although there may be secondary peaks in suburban areas of new development, close to transport links etc. Task 1 - Using the video , complete the note taking sheet below focusing on the Bid Rent Theory model. |
|
|
Focus 1 - Retail This activity can be adapted for your school locality depending on the availability of Google Street View imagery. CBD - The retail area in the centre of a city (Toulouse shown to the right) is is characterised by:
Many of the items offered for sale could be classed as high order with a large range & threshold. Task 2: What does 'good range' and 'threshold' refer to when talking about goods offered to consumers? Help sheet here. Task 3: Annotate your worksheet using Toulouse CBD as an example with the information above added. Shopping Parades Shopping parades consist of a cluster of shops, often around our area around a central car park (see example to the right in Pibrac, part of the Toulouse conurbation). This particular example has a small supermarket (Carrefour Market), bakery, butchers, bistro, bank, presse and florists. The goods for sale in these parades could often be classed as lower order with a smaller range and threshold. Task 4: Annotate your worksheet using using Pibrac as an example with the information above added. Retailing Revolution - Out of town shopping Due to increasingly high rental prices in the CBD, issues surrounding congestion and parking charges, many superstores and hypermarkets and gathered together to form out of town retail developments. There are two major centres in Toulouse, in Blagnac and the other in Portet (Ikea). Task 5 - Using the information from this help document, annotate the reasons behind the changes in shopping habits around the Blagnac out of town shopping centre image. Of course, local councils are now realising that business is being lost from the CBD and are therefore setting up renovation schemes and public transport initiatives to bring the public back to the city centre. Click here to find out about such an initiative in Toulouse (in French). For non French speakers, here is an excellent article about the history of the process of decentralization in the UK and the so called 'back to the city movements' that have sprung up in response. |
|
Task 6 - In the space provided on the worksheet, comment on the changes that have been made in central Toulouse / CBD's in the UK in an attempt to stop the outflow of retail to the suburbs and rural urban fringe (decentralization).
Physical Factors Affecting Settlement Growth
This activity can be adapted for the locality of your school. A quick check on Google Maps with elevation turned on, should reveal everything you need to know.
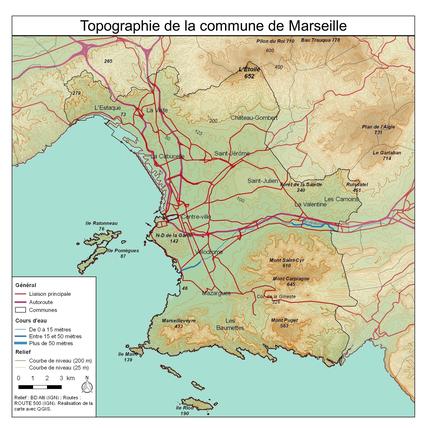
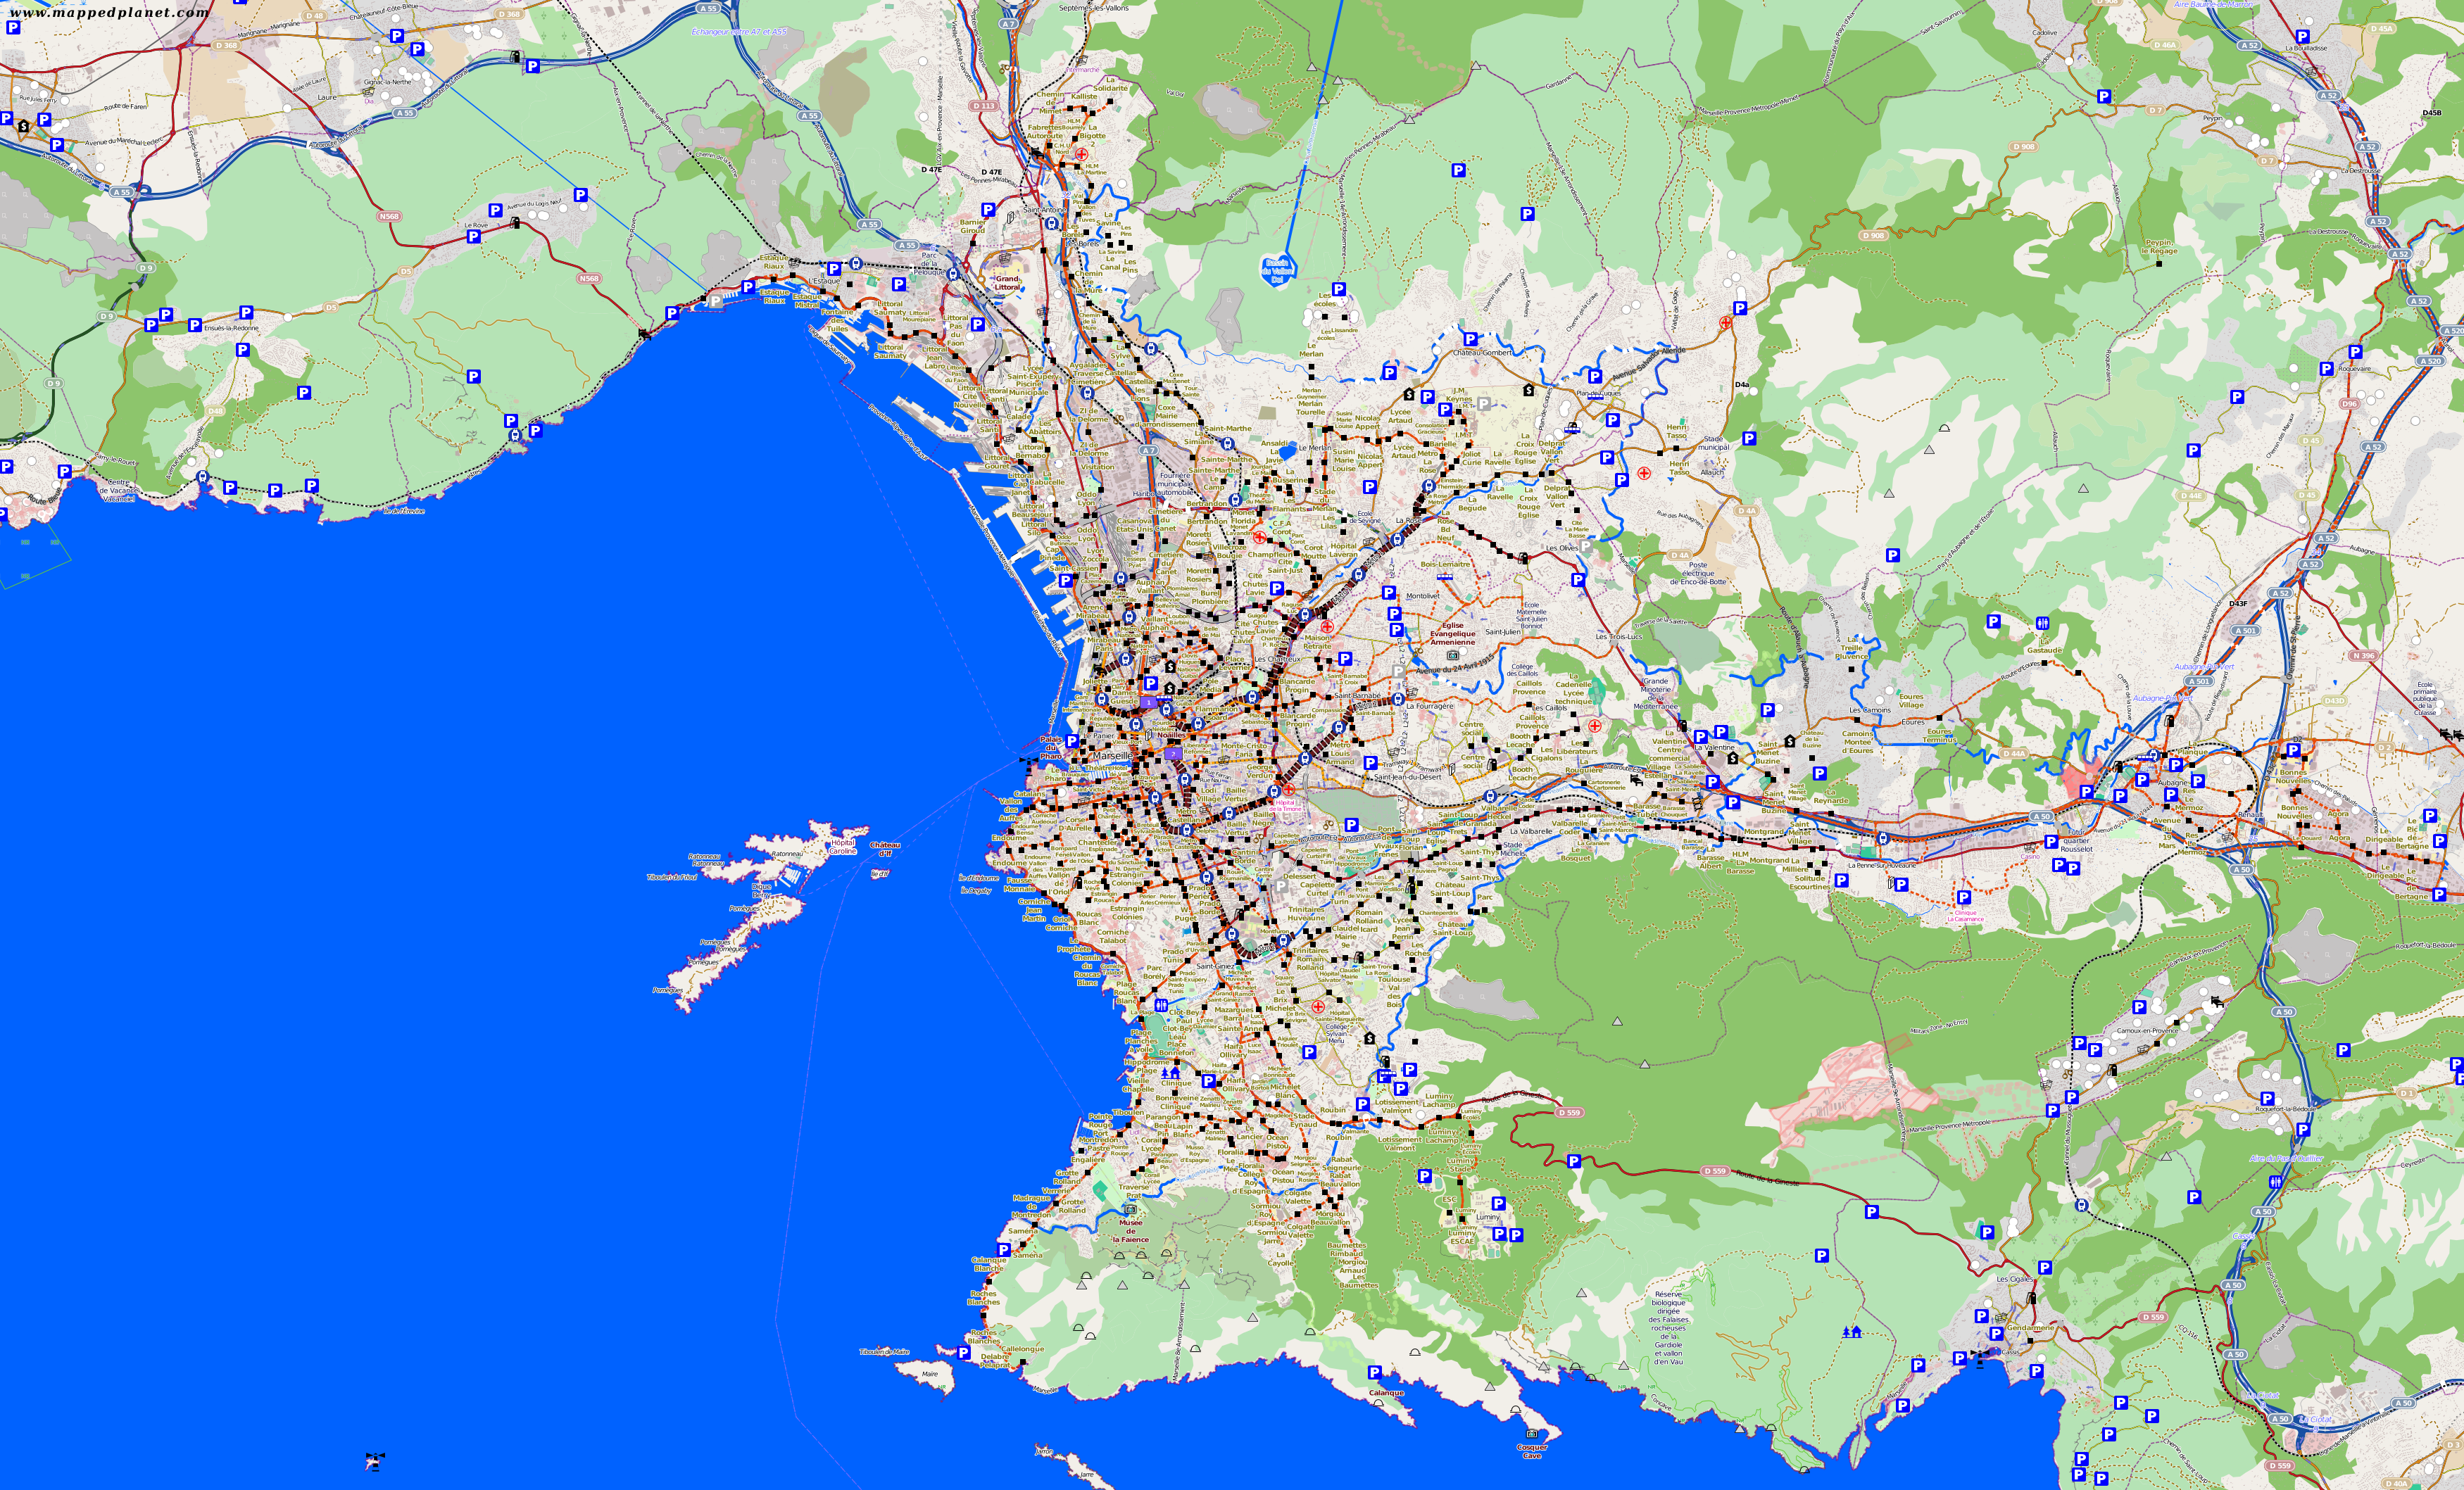
The maps below are of the settlement of Marseille in France. Click on both of the maps to enlarge.
Task 7 - Conduct some analysis on how physical characteristics (relief & coastline) of the place have affected the growth and shape of the settlement of Marseille, France.
Create an annotated document including both of these maps together with a suitable photo of the city too. You can click on each image below to make it larger and easier to view.
Patterns in the CBD...
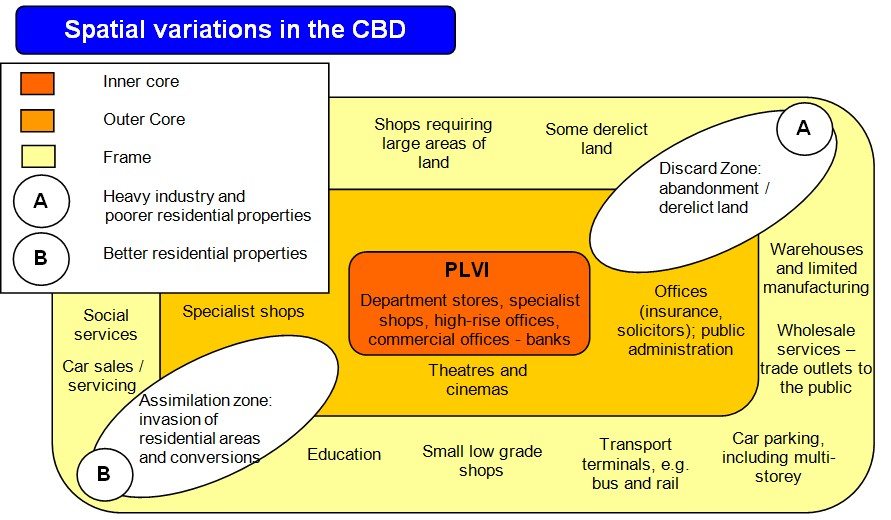
Task 1 - Using a copy of the model above, the embedded document below, create a 1 sided fact sheet that explains how the proximity to the CBD affects land values and how the CBD can be divided in two distinct zones.
Task 2 - Make notes on the factors that affect the patterns of residential areas in urban areas using the information above.
Task 3 - This activity can be adapted for the locality of your school using OpenStreetMap. See below.
IST students
Now put this into practise. Click this link that will take you to OpenStreetMap. It shows you the area around the International School of Toulouse. On the menu on the right hand side of the screen, click on the 'i' symbol and choose 'Map Key'. Explain the patterns of residential land use in Colomiers and try to link it to physical and economic characteristics of the area.
The incidence of poverty, deprivation and informal activity (housing and industry) in urban areas at varying stages of development...
We will briefly look at the incidence of poverty, deprivation in two different cities in two different countries.
Starter - Read this excellent article from the Chicago Council on Global Affairs and this article from weforum.org that aims to quantify why inequality exists within cities and why they can't be a place purely for the most wealthy.
Example 1 - Barcelona, Spain (HIC)
Task 1 - Find out a bit more about Barcelona and take some notes on the key demographics by clicking here.
Task 2 - Using the excellent information from the Barcelona Field Studies Centre below, print out and highlight the key elements of incidence of poverty & deprivation (red) and informal activity (blue) on the text.
Example 2 - Nairobi, Kenya
Task 3 - Find out a bit more about Nairobi and take some notes on the key demographics by clicking here
Task 4 - Read this excellent article by Matt Burdett and complete the activities at the bottom of the page.
Task 3 - Find out a bit more about Nairobi and take some notes on the key demographics by clicking here
Task 4 - Read this excellent article by Matt Burdett and complete the activities at the bottom of the page.

