IGCSE Geography Coursework - 27.5%
Your IGCSE Geography coursework is essential to your qualification and aims to show that you are able to collect data, process it and then find the best way to answer your question with all the information you have gathered. This piece of work relates to the 'Settlement' unit of work and in particular, the section below. It is important that you recognise that what we have studied, links to the Cambridge IGCSE Geography syllabus.
Our study of the impacts of urban renewal in Berlin link to 'causes and solutions of the problems of urban areas' and for Berlin are specific to World War 2, the allied bombardment, post war division and the Cold War, reunification and then the rapid urban renewal projects. The 'conflicts over land use change' refer to the gentrification issues in East Berlin.
Your coursework will be a written report of no more than 2000 words. It is worth up to 27.5% of your total qualification.
You will hand in each chapter and receive feedback on the work but only if you meet the deadline set by Mr Podbury. All work must be uploaded to ManageBac by the deadline. Work that is late will not be considered for first draft marking and no feedback will be given.
How will your work be marked?
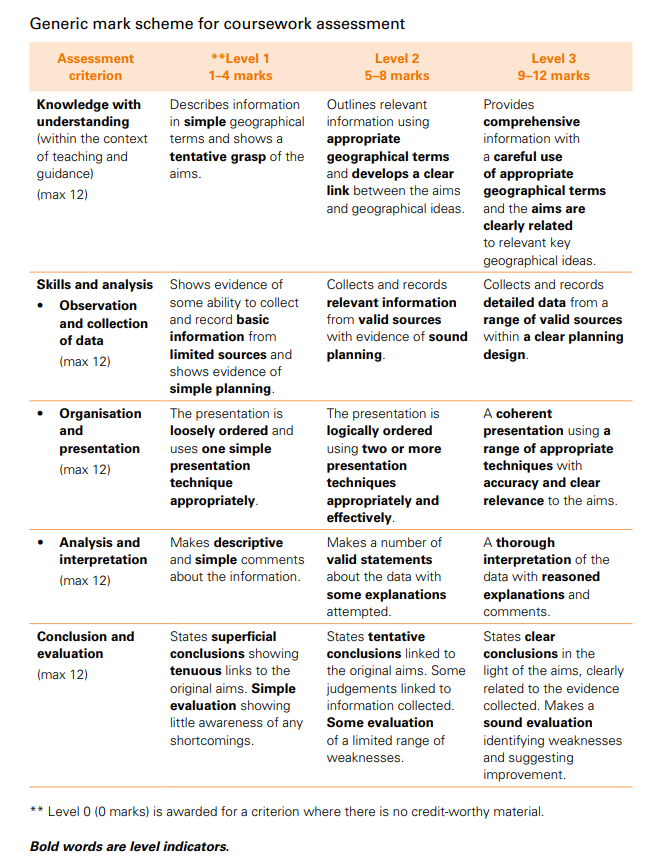
The grid below shows you how you work will be marked. It is important that you look carefully at the words in bold as they are the markers for getting into the higher mark bands.
The Fieldwork Study Locations in Berlin
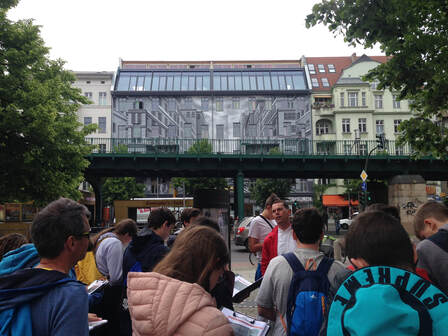
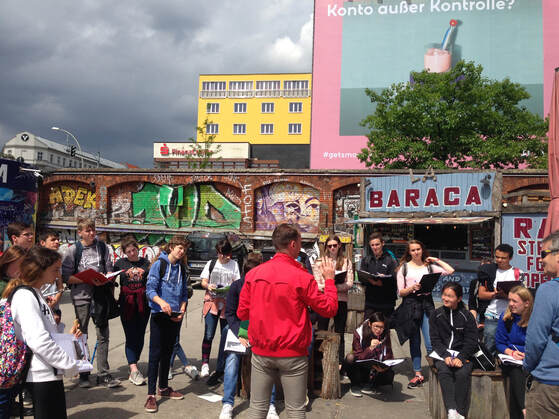
During our visit to Berlin and during our guided tour with Nikolai, you took lots of notes and photos specific to each of the study areas. The embedded map below shows our tour, but you'll need to zoom in to see in more detail.
Just in case you need to go back there 'virtually', you will find a Google Streetview embedded below for each of the 7 study locations. You can click on the 'View on Google Maps' to take you to a full screen version.
|
Study Area 1
Study Area 4
|
Study Area 2
Study Area 5
|
Study Area 3
Study Area 6
|
Chapter 1 - Introduction (12 marks)
Word Count 400
Your investigation title is: World War 2 to Cold War. Reunification to Gentrification. The impacts of urban renewal on East Berlin.
Step 1 - Write this title down on the top of your introduction page.
To investigate the question above, you will be answering the research question below:
The research question: How and why has Eastern Berlin been improved and have these improvements been successful?
Step 2 - Write the research question down below your investigation title.
At this point, you must formulate one or two hypotheses to test against the question. (A hypothesis is a statement that you can test. A well written hypothesis is clear, directional and measurable). There are some examples below:
* urban renewal has mostly been successful / unsuccessful.
* urban renewal always leads to gentrification in East Berlin.
* Local people always benefit from urban renewal.
* Tourists cause gentrification in East Berlin
etc etc...
Step 3 - Now tell the examiner which one / two hypotheses you will be testing.
Step 4 - Describe the brief history of Berlin. This should include perhaps a timeline of key events from the 1920's to present day. This should focus on the destruction and then division of the city and why the East was left behind until reunification. **IGCSE Historians, you can show off a bit here**
Step 5 - Then, explain the geographic theory surrounding urban renewal and how this can lead to gentrification. This will need to be linked to the history of Berlin from the end of the Second World War right up to present day. (you did this before leaving for Berlin).
**The DVD Berlin video by Matt Frei (IST students - On school media drive) will also provide excellent context**
Step 6 - Draw a small map of Germany to show the location of Berlin. Label surrounding countries, sea to the north and add North arrow and scale line.
Step 7 - Now draw a map of the conurbation of Berlin. Once you have done this, it would be useful to overlay the path of the Berlin Wall (pre 1989) and the Death Strip
Step 8 - State the relationship between the coursework and the IGCSE Geography syllabus. See the top of this page for more detail.
Chapter 2 - Methodology (12 marks)
Word Count 300
You are going to write up your methodology where you will say where and how you collected your data. You must be precise and detailed in your descriptions to be able to access full marks on this section.
Step 1 - Describe how you collected:
a) secondary data such as background video tasks and our tour guide and resident of Berlin for 10 years, John.
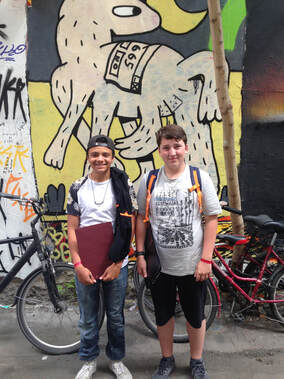
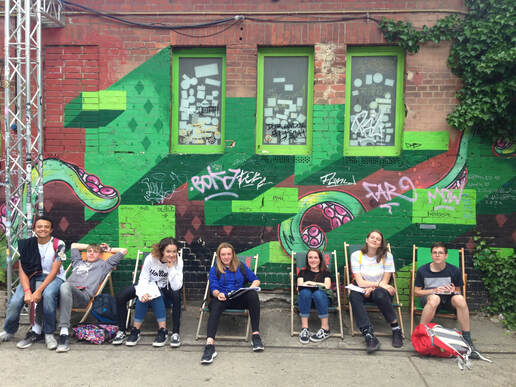
b) primary data - your surveys in your booklet as well as photos taken. Try to include photos of you in the field carrying out the surveys if possible. Also, say that you carried out the surveys in six locations around the city.
1. Perception Survey
2. Index of Services and Amenities
3. Index of Residential Decay
4. Conflict Matrix
For each of the four surveys, you should include:
a) a copy of the tables and a brief explanation of why the total scores differ (where relevant).
b) underneath each copy, justify the relevance of the method to your research question / hypotheses
c) explain what high / low scores in each survey might suggest but don't talk about the actual data you collected.
Step 2 - Now include a zoomed in copy (with a credit in the references section) of the Google Map provided by Mr Podbury to show the location of our study areas in East Berlin. Annotate the different locations of your chosen study areas onto the map to clearly identify the different study areas.
Chapter 3 - Data Presentation (12 marks)
Word Count - 0
This is the biggest section of the coursework and where most of the marks are gained. The data presentation refers to any graphs, charts or annotated photos you include whilst the interpretation is how well you make sense of the data and link it to your research question and hypotheses. It's where you really show that you know your stuff!
To do this, you'll need to choose three or four study areas to focus on. You may want to choose the ones that your found most interesting. If you choose the courtyards (study location 2 & 3), it would be good to include both as a very good comparison.
Data Presentation
You collected data using the following surveys:
1. Perception Survey (what do high & low scores indicate?)
2. Index of Services and Amenities (higher totals indicate gentrification occurring)
3. Index of Residential Decay (what do high & low scores indicate?)
4. Conflict Matrix (why might a high number of conflicts among stakeholders be problematic?)
... plus, you took a lot of photos and took extensive notes when John was talking.
REMEMBER! What are you trying to show here?
1. How and why has Eastern Berlin been improved and ...
2. Have these improvements been successful?
Download this Excel Data Recording Sheet and this Instruction Sheet .
Step 1 - PHOTOS
Sort through your photos. Find the photos of the study areas that you are going to use later. Create four folders in your My Documents that have the same name as the study areas e.g. Courtyard 1 etc.
Create a photo evidence board. To do this, mix the photos you have taken with either a Google Map or perhaps this map of the extent of gentrification in Berlin. The final product would have to be printed in A3 size to make sure that it was clear.
Step 2 - NOTES
Write up your notes using this template. Once you have chosen the four areas you would like to study, go back through your notes from John and write them up in the spaces provided. You can delete the study areas that you are not using.
Step 3 - PROCESS YOUR DATA IN EXCEL / HAND DRAWN MAPS
For each chosen study area, start processing your data (methods 1-4). Choose which data from each of the surveys you are going to need to answer each part of the Research Question (above in red).
Note: After a few questions from the class, I have listed below the types of charts you might want to use for each of the data sets. I hope this helps.
Perception Survey - One Chart
* Bar Chart or Radar Chart to either show Positive or Negative qualities of each of the zones.
* If your zone has positive and negative results, enter the negative scores as -1, -2 & -3 and Excel will plot them together on the same chart with the positive bars going upwards and the negative bars going downwards.
Then match up the photos that show your results!
Index of Services & Amenities - Two charts.
* One bar graph showing the total number of services & amenities for each zone
* One table showing the three ranges (1, 2 & 3) and which zone each range falls into.
**Remember Range 1 (services used by traditional resident), Range 2 (services used by trad residents & tourists) Range 3 (services used mostly by tourists or luxury items)
Then match up the photos that show your results!
Residential Decay Index - Three or four charts (depends on number of zones).
* One radar chart showing one of the factors (e.g. structural damage) for each of your zones.
* Then do this for another two factors (part peeling & deterioration of walls)
Then match up the photos that show your results!
Conflict Matrix - One graph
* Bar or line graph to show the total number of conflicts in each or your chosen zones.
Then match up the photos that show your results!
This is the biggest section of the coursework and where most of the marks are gained. The data presentation refers to any graphs, charts or annotated photos you include whilst the interpretation is how well you make sense of the data and link it to your research question and hypotheses. It's where you really show that you know your stuff!
To do this, you'll need to choose three or four study areas to focus on. You may want to choose the ones that your found most interesting. If you choose the courtyards (study location 2 & 3), it would be good to include both as a very good comparison.
- So, which places gave you the best impressions of how East Berlin has been improved?
- Has it improved the life for everyone there?
- Has it caused conflict?
- Has gentrification taken place?
Data Presentation
You collected data using the following surveys:
1. Perception Survey (what do high & low scores indicate?)
2. Index of Services and Amenities (higher totals indicate gentrification occurring)
3. Index of Residential Decay (what do high & low scores indicate?)
4. Conflict Matrix (why might a high number of conflicts among stakeholders be problematic?)
... plus, you took a lot of photos and took extensive notes when John was talking.
REMEMBER! What are you trying to show here?
1. How and why has Eastern Berlin been improved and ...
2. Have these improvements been successful?
Download this Excel Data Recording Sheet and this Instruction Sheet .
Step 1 - PHOTOS
Sort through your photos. Find the photos of the study areas that you are going to use later. Create four folders in your My Documents that have the same name as the study areas e.g. Courtyard 1 etc.
Create a photo evidence board. To do this, mix the photos you have taken with either a Google Map or perhaps this map of the extent of gentrification in Berlin. The final product would have to be printed in A3 size to make sure that it was clear.
Step 2 - NOTES
Write up your notes using this template. Once you have chosen the four areas you would like to study, go back through your notes from John and write them up in the spaces provided. You can delete the study areas that you are not using.
Step 3 - PROCESS YOUR DATA IN EXCEL / HAND DRAWN MAPS
For each chosen study area, start processing your data (methods 1-4). Choose which data from each of the surveys you are going to need to answer each part of the Research Question (above in red).
Note: After a few questions from the class, I have listed below the types of charts you might want to use for each of the data sets. I hope this helps.
Perception Survey - One Chart
* Bar Chart or Radar Chart to either show Positive or Negative qualities of each of the zones.
* If your zone has positive and negative results, enter the negative scores as -1, -2 & -3 and Excel will plot them together on the same chart with the positive bars going upwards and the negative bars going downwards.
Then match up the photos that show your results!
Index of Services & Amenities - Two charts.
* One bar graph showing the total number of services & amenities for each zone
* One table showing the three ranges (1, 2 & 3) and which zone each range falls into.
**Remember Range 1 (services used by traditional resident), Range 2 (services used by trad residents & tourists) Range 3 (services used mostly by tourists or luxury items)
Then match up the photos that show your results!
Residential Decay Index - Three or four charts (depends on number of zones).
* One radar chart showing one of the factors (e.g. structural damage) for each of your zones.
* Then do this for another two factors (part peeling & deterioration of walls)
Then match up the photos that show your results!
Conflict Matrix - One graph
* Bar or line graph to show the total number of conflicts in each or your chosen zones.
Then match up the photos that show your results!
Chapter 4 - Data Interpretation (12 marks)
Word Count - 1000
To do this, you need to split your investigation title in two and spend approximately 500 words trying to answer each.
Research Question 1 - Why and how has Berlin been improved (500 words).
Why?
To answer the why part of the question, you'll need to concentrate on the historical story of the city:
Step 1 - Start with the devastation of the city in 1945 (no need to knock down and start again as the bombing campaign did that for them). Historical photos would be really good here & make sure you reference them carefully.
Step 2 - Then move on to the division of the city by the Berlin wall and the differences in development between the East & West. Photos would be really good here & make sure you reference them carefully.
Step 3 - Present day issues. You can check out this 2019 article about the AirBnB issue here as well as this 2019 article from the BBC.
How?
Step 4 - Write up your notes from John on each of your four study areas
Step 5 - Annotated photos to show the improvements. These should be carefully chosen to show those areas that have certainly improved (with figure numbers)
Step 6 - Interpret your Index of Services & Amenities for each of your zones making reference to the three different levels.
Research Question 2 - Have these improvements been successful? (500 words)
To do this, you will need to talk about your remaining graphs, charts and photos here.
Step 7 - Interpret your perception surveys for each of your zones & include photos to back it up with annotated photos
Step 8 - Interpret your residential decay index for each of your zones and include photos to back it up with annotated photos
Step 9 - Conflict matrix (high conflicts = issues, low conflict = settled) - Interpret and add additional information from John & Pod Casts & Videos on the back ground tasks page (see Step 3)
Chapter 5 - Conclusion & Evaluation (12 marks)
Conclusion: Word Count 200
**IST students - please don´t do this section until you have made changes to your data interpretation after reading my feedback on ManageBac.
Start a new page - Title: Conclusion
A conclusion is just that. You have short number of words to revisit your research question (RQ's) and answer it succinctly. The conclusion must be clear and to get the highest marks, you must use the most important pieces of data to back up your claims.
To recap:
Part 1 - How and why has Eastern Berlin been improved?
Part 2 - Have these improvements been successful?
Also, make sure you also answer your hypotheses by summarising the main evidence that supports or rejects the hypothesis statement.
Evaluation: Word Count 100
Start a new page - Title: Evaluation
An effective evaluation must re-visit each of the methods you used in the methodology. You were given methods to use that were not perfect and that could be improved.
You must evaluate their strengths and weaknesses and make suggestions for how you might improve the study if you were to go again.
Think about:
1. Perception survey - Based on your opinion only and someone who is not from Berlin. (safe, dangerous, improving, declining - emotive and based on your experiences of cities). How could you improve this next time?
2. Index of Services & amenities - could you & did you record them all? Closed shops? How could you improve this next time?
3. Time of visit to study areas (conflicts) - we visited in the day time on a Tuesday afternoon in May. Issues? Did we get the read pictures of what all these zones were like at their busiest?
4. Data collection method - We collected data in small groups. Bias? How could you improve this?
5. Building Decay Index - You are not architects or Town Planners. How could this be improved?
6. Personal bias - We didn't speak to anybody other than Nikolai. Interviews with the public weren't possible because of language barriers.
References
You will need to complete your reference page citing any websites, books, videos, people etc. that you have consulted in the production of this coursework.
Use this excellent Citation Generator Tool from Mr Tarr´s Classtools site to help you to do this.
This piece of work is the last think in your coursework and does not count in the total word count.
Use this excellent Citation Generator Tool from Mr Tarr´s Classtools site to help you to do this.
This piece of work is the last think in your coursework and does not count in the total word count.


