
What you'll need to know...
KEY CONCEPT - How physical and human factors exacerbate and mitigate flood risk for different places
Hydrograph characteristics (lag time, peak discharge, base flow) and natural influences on hydrographs, including geology and seasonality
How urbanization, deforestation and channel modifications affect flood risk within a drainage basin, including its distribution, frequency and magnitude
Attempts at flood prediction, including changes in weather forecasting and uncertainty in climate modelling
Flood mitigation, including structural measures (dams, afforestation, channel modification and levee strengthening) and planning (personal insurance and flood preparation, and flood warning technology)
• Two contrasting detailed examples of flood mitigation of drainage basins
Starter: Watch this 2023 from The Guardian!
Hydrograph Characteristics...
|
Objective: To describe the characteristics of a hydrograph. Analyse the reasons for spatial and temporal (short term and long term) variations in hydrographs.
Starter: Watch the first video to the right hand side. What factors affect the shape of the yellow graph? Background: There are eight key controls that affect drainage basins and ultimately the shape of the resultant flood hydrograph: 1. Basin size, shape and relief 2. Types of precipitation 3. Temperature 4. Land use 5. Geology 6. Soil Type 7. Drainage Density 8. Tides and storm surges These eight controls should not be viewed in isolation to one another. It is rare that just one of these control mechanisms would contribute towards a major event in a drainage basin. They should therefore be viewed as an interacting set of factors (systems thinking) that contribute towards the behaviour of the basin. Task 1 - Use page 62-63 of Waugh – Integrated Approach to make notes on the 8 key DB factors. Where possible, try to find an example (photo, graph or quote) to further illustrate the point. Complete your work on the worksheet (enlarged to A3) on the right. |
|
Task 2 - Go to the GATW site by clicking here and complete the living graph activity.
Task 3 - Open Geo Factsheet n.o 83 from January 2000 and complete the activities on the last page (subscription required).
Task 3 - Open Geo Factsheet n.o 83 from January 2000 and complete the activities on the last page (subscription required).
Exam Corner - Paper 1 - 10 Marks
Examine the impacts of human activity on river hydrographs. [10]
Factors affecting flood risk within a drainage basin...
Objective: To discover how urbanization, deforestation and channel modifications affect flood risk within a drainage basin, including its distribution, frequency and magnitude
Task 1 - Watch the three videos below and study the three pieces of information below too. Make notes on the worksheet embedded of the three factors that affect flood risk in terms of its distribution, frequency and magnitude.
Attempts at flood prediction...
Objective: To recognise and be able to evaluate the attempts at flood prediction, including changes in weather forecasting and uncertainty in climate modelling
You have now seen how hydrographs are constructed and how they can be used as a tool to predict flood events in places based on precipitation and basin geomorphology. However, they do require data to be collected and this generally comes from historical events as well as drainage basin surveys. However, we don't have a data set stretching back many hundreds of years and much of our data might only have been generated in the last 50 years or so (depending on level of development).
Climate modelling has helped to make incredible strides (possibilities) in terms of advanced weather forecasting, predicting impacts of tropical storms and has undoubtedly saved lives. However, limitations still exist such as the inability to predict a flash flood event and the constantly changing landscape caused my human intervention. Find out more about Climate Modelling here.
By far and away the biggest natural hazard to face increasingly vulnerable populations is flooding. You should understand that this is due to a number of processes such as increased population pressure, rapid urban growth, deforestation, climate change and channel modifications (synthesis approach!). So how can flood prediction technology be taken seriously if there is uncertainty over the validity of climate modelling with governments around the world (power) under pressure to find a solution?
Types of uncertainty “there are known knowns; there are things we know we know. We also know there are known unknowns; that is to say we know there are some things we do not know. But there are also unknown unknowns - the ones we don't know we don't know.“
Donald Rumsfeld, US Defence Secretary 2001-2006
How does uncertainty arise?
......so we often cannot discriminate between competing models
(Professor Paul Bates, University of Bristol).
- We have incomplete knowledge of the real world - Even our best understanding of processes or the current state of the system may still be wrong
- Time, money and computer power are limited so models are approximations
- We often cannot measure everything we need to know so we often cannot measure everything we need to know
- Even for approximate models we may require further assumptions and all data has error
......so we often cannot discriminate between competing models
(Professor Paul Bates, University of Bristol).

Task 1 - Use the six pieces of information above and your own research to put together an essay plan to answer the following Paper 1 Option A question:
2 a. Examine the impacts of improved weather forecasting and climate modelling in the prediction of flood events. (10)
2 a. Examine the impacts of improved weather forecasting and climate modelling in the prediction of flood events. (10)
Flood mitigation - Part 1: Structural measures...
Objective: To evaluate the success of dams, afforestation, channel modification and levee strengthening as flood mitigation schemes.
Task 1 - Using the embedded Slideshare presentation above as your primary source of information, as well as the four additional resources above, evaluate* the success of dams, afforestation, channel modification and levee strengthening as flood mitigation schemes.
*Evaluate (AO3): Make an appraisal by weighing up the strengths and limitations
Ensure you define hard and soft engineering schemes too.
*Evaluate (AO3): Make an appraisal by weighing up the strengths and limitations
Ensure you define hard and soft engineering schemes too.
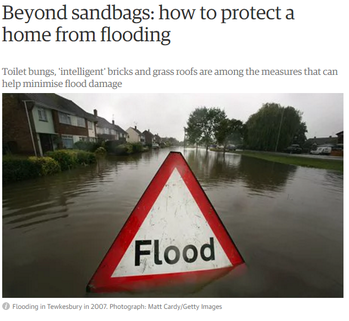
Flood mitigation Part 2 - Planning...
|
Objective: To evaluate personal insurance, flood preparation and flood warning technology as effective ways of mitigating against floods.
|

|
|
|
|
Task 1 - Take notes on the three ways of mitigating against the flood risk using the note taking framework below.
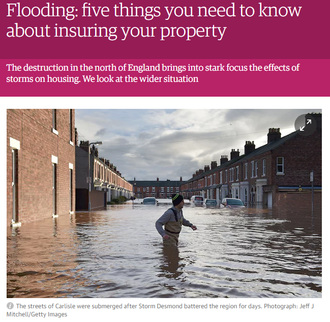
These are heavily focused on the United Kingdom, a HIC that has seen an increase in severe flood events in recent years partly due to urban sprawl, a reported affordable housing shortage in the South East and subsequent issues with building on flood plains.
Task 2 - Read this 2022 article about the ability of the poorest people in the United Kingdom to afford flood insurance. Pay attention to the section entitled '‘We could be creating flood risk ghettos‘. Make notes on the worksheet.
Fine tuning your Paper 1 skills:
Evaluate the contribution individuals and communities can make towards mitigating their local area’s vulnerability to flooding(10)
* mark scheme for the question above available in the sample exam pack released by the IB and available on their site. Question 2B - Option A
Managing the Flood Risk - Two contrasting examples
Case Study 1 - Toulouse and La Garonne (Europe).
Click here to find about more about the history of flooding in Toulouse (in French). Then watch the video above to show what the city is doing to protect a vulnerable population of more than 1.4 million people.
Below, you can see some Google Street View images showing various means of flood protection around the River Garonne in central Toulouse. The first street view on the left hand side shows you a gate that closes across the road called Avenue de la Garonette. To see this gate at work in a recent flood event, click here.
|
|
|
Task 1 - Using an A3 sheet with a satellite map of Toulouse in the centre, locate each of the flood prevention techniques above and create a short piece of writing to explain how each strategy works and aims to protect vulnerable populations from the impacts of a flood event.
Case Study 2- Tokyo and the tunnel flooding system (Asia)
Task 2 - Watch the video above and take detailed notes on at least three ways in which Tokyo is managing the flood risk in the biggest city in the world!
Exam practice.
With reference to one named floodplain, evaluate the costs and benefits of different stream management strategies. (10)