What you'll need to know...
KEY CONCEPT - How population varies between places
Physical and human factors affecting population distribution at the global scale
Global patterns and classification of economic development:
• low-income countries
• middle-income countries and emerging economies
• high-income countries
Population distribution and economic development at the national scale, including voluntary internal migration, core-periphery patterns and megacity growth
• Two detailed and contrasting examples of uneven population distribution
Synthesis, evaluation and skills opportunities
The relative importance of different influences on where people live and spatial interactions between places at varying scales
What do you know about the world and its population?
|
You are going to be answering 13 questions (timed of up to 45 seconds per question) on the World around you. Please complete the test and then make a note of your score.
If you got any questions incorrect, please copy and paste your response and correction on the last page into a word document. Once you have done this, write out the following title - 'My Top Three Global Misconceptions' Underneath this, try to explain why you had misconceptions about certain places and patterns that exist globally. Now watch the video by Orla Rosling to the right and take further notes on how you compared to the average respondent of this test. |
|
Factors affecting population distribution at the global scale...
|
Spend a little time watching the video below. It shows the growth of world population over time plotted against historic events and migrations. Note the increase levels until the early 1800's.
You are going to be completing a summarising task using the worksheet below. This sheet aims to show you the major factors that influence population distribution and asks you to use your own knowledge to suggest places where this may be evident. |
Global patterns and classification of economic development...
|
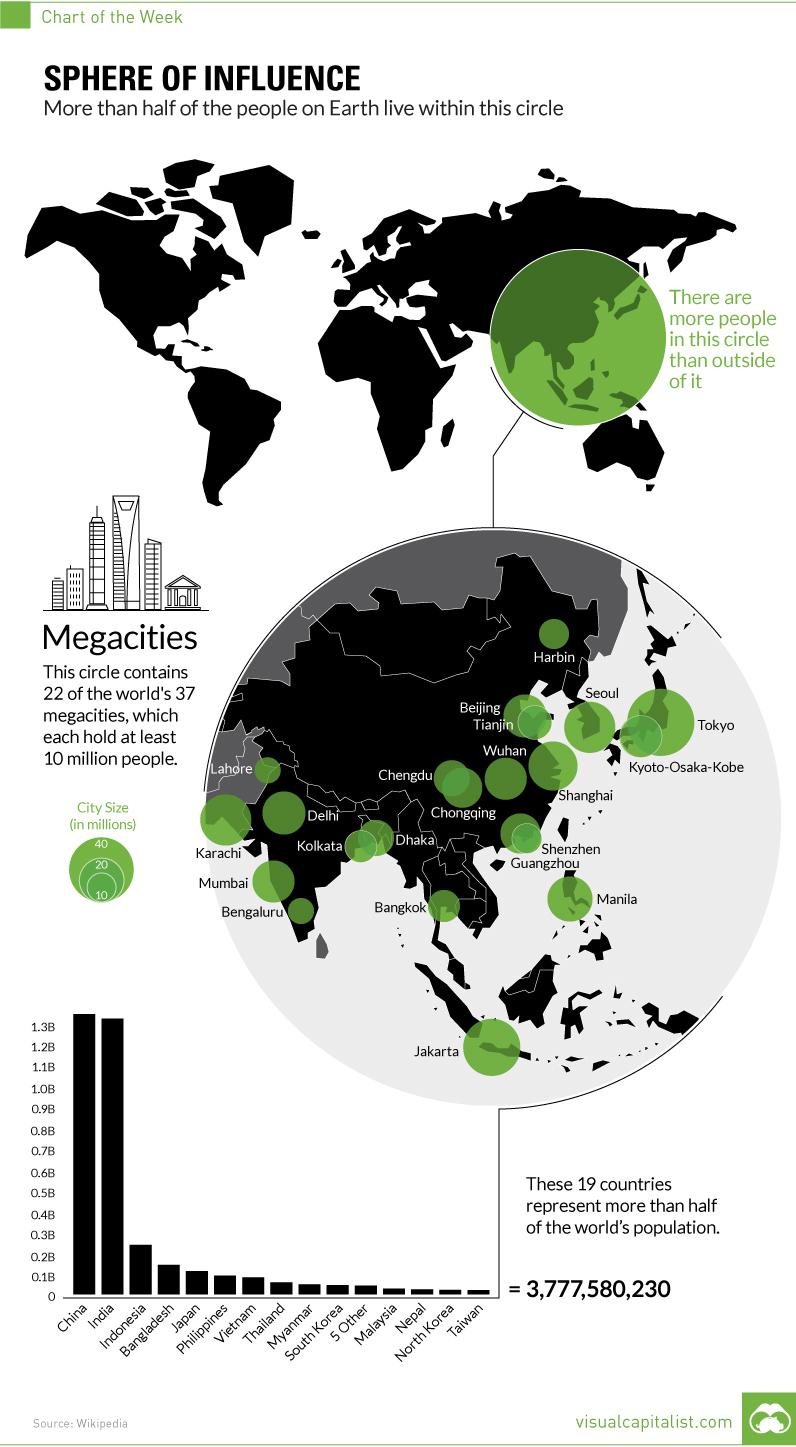
Watch the video by Hans Rosling (founder of Gapminder) that shows the distribution of population by wealth across the world.
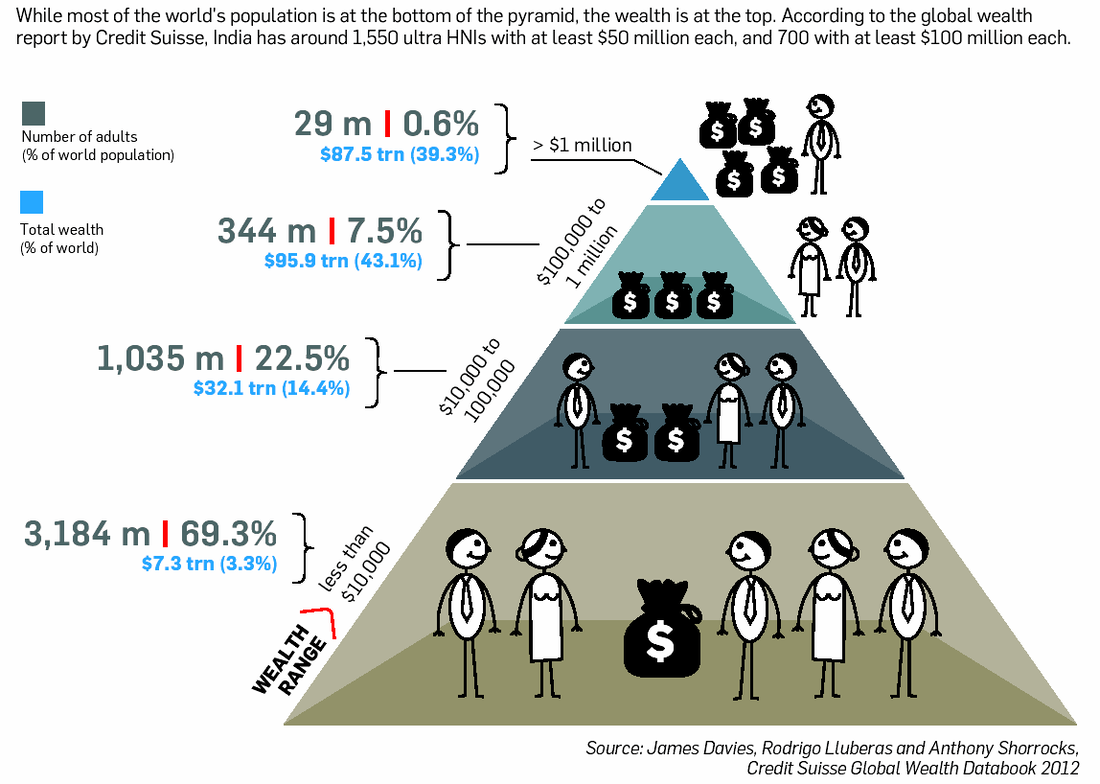
The World Bank classifies countries into different levels of economic development. The most recent figures for 2021 are shown below in the table. Task 1 - Using the table above, the World Bank interactive website at the tab above and the worksheet above right, complete all the activities set out. Task 2 - Study the infographic to the right and complete the following questions on your worksheet. 1. State the total wealth percentage shared by the richest percentage group on the infographic. 2. State the total combined wealth of the world. 3. Suggest one improvement to the infographic. |
|
Population distribution & economic development, including voluntary internal migration & core-periphery patterns...
This section of the work requires two detailed and contrasting examples of the above. We will be using France and Ethiopia as our examples. We will not cover megacities in this section as we have already looked at Mumbai in the Urban Environments unit of work here.
France - Population Distribution...
France, or the French Republic, is located in western Europe, with many overseas regions and territories. Metropolitan France extends from the English Channel and North Sea to the Mediterranean Sea and from the Atlantic Ocean to the Rhine, bordering Luxembourg, Germany, Belgium, Switzerland, Italy, Spain, Andorra, and Monaco.
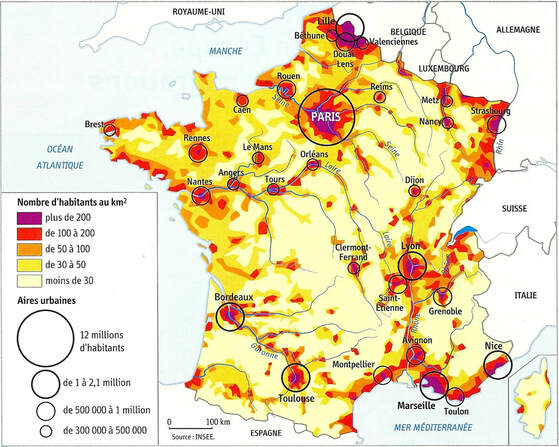
France has a population of 67 million with 11 million or 20.5% of the urban population living in the conurbation of Paris and a further 23% of people living in cities with conurbations of over 1 million people. The population density of France is 122 people per sq km with an urban population growth rate of 0.7%. 75% of the population lives on 16% of the territory area.
|
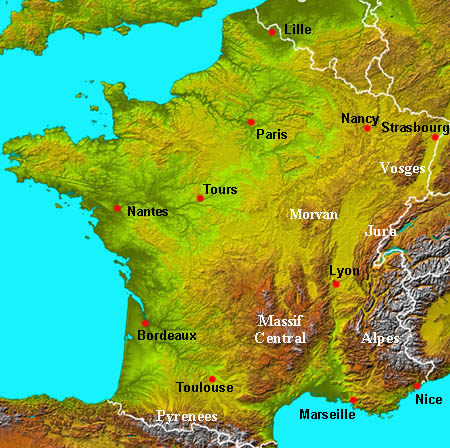
Task - Study both maps above. The first is a choropleth map that shows the population distribution of France (note key) and the second shows the major settlements and upland areas of the country.
1. Describe population distribution of France. 2. The population distribution of France can be referred to as 'uneven'. Give three physical reasons why it is uneven referring to: i. relief ii. rivers iii. proximity to coastal areas. 3. Give three human reasons for the uneven population distribution in France. This graphic might help you. |
|
4. Study the Rural Population graph for France from the World Bank to the right from 1960 to 2021.
i. What was the breakdown of population (% Rural % Urban) in 1960, 1990 and 2021?
5. Using all the resources in this section and an annotated map, describe the core and periphery pattern that exists in France in terms of its population distribution.
i. What was the breakdown of population (% Rural % Urban) in 1960, 1990 and 2021?
5. Using all the resources in this section and an annotated map, describe the core and periphery pattern that exists in France in terms of its population distribution.
France - Internal Migration...
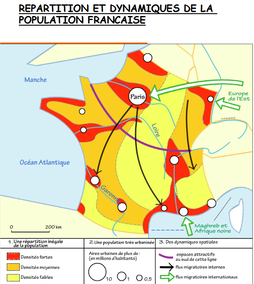
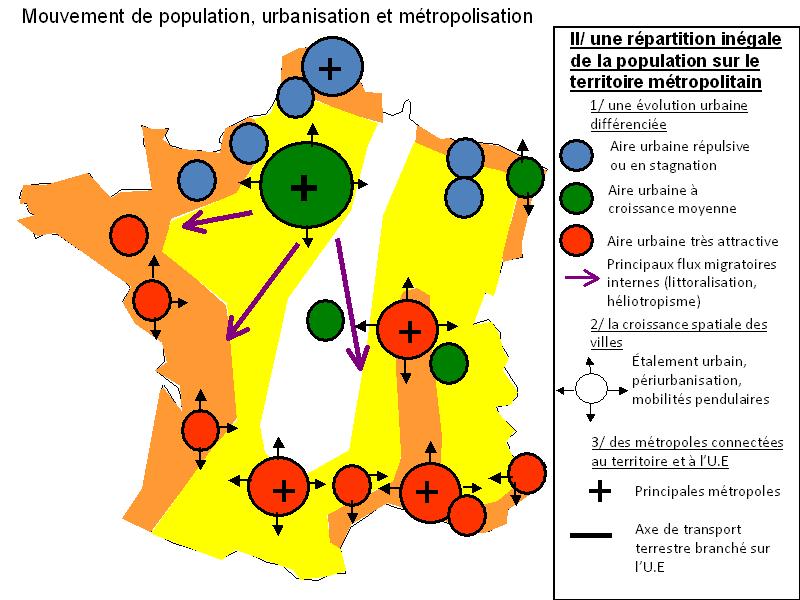
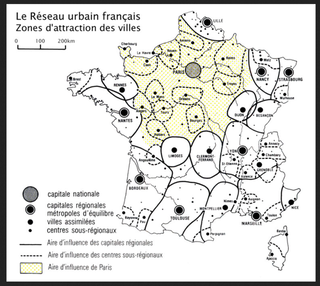
Study the three graphics above by clicking on each to enlarge.
The first map shows population distribution, major settlements and migration flow lines (internal and external).
The second is a flow map shows major settlements characterised by whether they are maintaining or stagnating (blue), maintaining stable growth from migration (green) or experiencing rapid growth from migration (red)*. It also shows migration flows and from which direction they gain populations. *Thanks to Seb & Elsa for translation!
The third is also a flow map is a sphere of influence map of France. It shows the cities throughout France as well as their influence zones. Note the influence of the capital city.
Task - Create a piece of commentary describing the movements and explaining why this internal migration is occurring. The following text from jmgleblog (in French) may help you:
L'Ile de France accueille les étudiants et les néo diplômés.
Les autres régions bénéficient plutôt de "retours au pays".
Le littoral méditerranée bénéficie de l'attrait de son climat (=héliotropisme).
Des apports migratoires concentrés vers les villes.
Ethiopia - Population Distribution...
With one of the highest poverty levels in the world, Ethiopia is considered by many to be one of the most under-developed nations in the world. But within its African boundaries lies a nation filled with a rich culture and heritage. It is a land locked country bordered by Kenya, South Sudan, Sudan, Dijibouti, Eritrea, and Somalia. The surface area in Ethiopia is currently at 1,104,300 km².
Ethiopia has a population of 105 million with 3.3 million or 16% of the urban population living in the conurbation of Addis Ababa and a further 3.25% of people living in cities with conurbations of over 1 million people. The population density of Ethiopia is 102 people per sq km with an urban population growth rate of 4.7%.
|
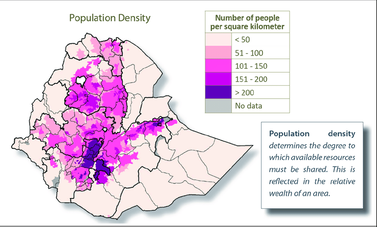
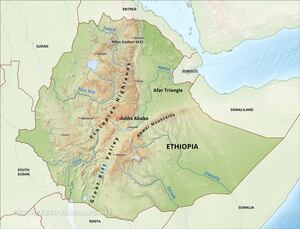
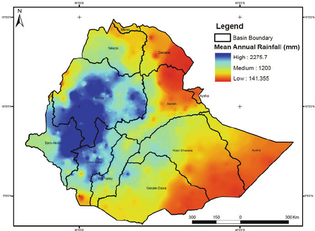
Task - Study the three maps above. The first shows the population distribution of Ethiopia (note key) and the second shows the major settlements and upland areas of the country and the third shows precipitation levels across the country.
1. Describe population distribution of Ethiopia. 2. The population distribution of Ethiopia, like France, can be referred to as 'uneven'. Give two physical reasons why it is uneven referring to: i. linking relief and precipitation levels (& link to agriculture) ii. rivers (not all have water flowing) 3. Give three human reasons for the uneven population distribution in Ethiopia. This CIA link might help you. |
|
4. Study the Rural Population graph for Ethiopia from the World Bank to the right from 1960 to 2017.
i. What was the breakdown of population (% Rural % Urban) in 1960, 1990 and 2017?
5. Using all the resources in this section and an annotated map, describe the core and periphery pattern that exists in Ethiopia in terms of its population distribution.
i. What was the breakdown of population (% Rural % Urban) in 1960, 1990 and 2017?
5. Using all the resources in this section and an annotated map, describe the core and periphery pattern that exists in Ethiopia in terms of its population distribution.
Ethiopia - Internal Migration...
Internal migration flows in Ethiopia are currently larger than external flows, but the exact number of people who migrate internally is not known. Internal migration occurs in the form of rural-urban migration, rural-rural migration, and resettlement policies, which are all substantial in Ethiopia. Internal migration in Ethiopia has traditionally occurred at marriage when the wife moves to live in the husband's community. In addition to this traditional internal mobility, urbanization in Ethiopia is a growing trend that puts pressure on urban infrastructure and resources (De Waal, 1991: Ezra & Kiros, 2001).
Task - Using the resources in the PDF (page 15-17), create a piece of commentary that explains the reasons for internal migration in Ethiopia. You should summarise your work under the headings below:
1. Rural to Urban Migration
2. Rural to Rural Migration
3. Resettlement
4. Trafficking of people
The growth of megacities...
Task 1 - Watch the video above from the Economist. Take notes under the following headings, using the prompts and timings:
00:00 - What are megacities? Define the population threshold required for megacity status to be 'achieved'.
01:01 - The problem with megacities
03:07 - How is Ahmedabad tackling rapid urbanisation?
04:45 - How can cities manage traffic?
07:04 - The problem with waste
08:00 - How is Recycle Central revolutionizing trash?
10:58 - What are the most urgent issues to resolve?
Context - We understand that a combination of physical and human factors influence global population distribution and economic development and that these factors can also be a cause for internal migrations to take place. France and Ethiopia are contrasting countries but both have uneven population distributions and both experience internal migration for very different reasons.

