
What you'll need to know...
KEY CONCEPT - How natural and human processes affect the global energy balance
The atmospheric system, including the natural greenhouse effect and energy balance (incoming shortwave radiation and outgoing longwave radiation)
Changes in the global energy balance, and the role of feedback loops, resulting from:
• terrestrial albedo changes and feedback loops
• solar radiation variations, including global dimming due to volcanic eruptions
• methane gas release and feedback loops
The enhanced greenhouse effect and international variations in greenhouse gas sources and emissions, in relation to economic development, globalization and trade
Synthesis, evaluation and skills opportunities
The complexity of the dynamic climate system and the spatial interactions of different processes and feedback mechanisms
If you see the SDG symbol flashing, don't forget that there is a clear link to one or more of the goals
The atmospheric system...
|
|
|
TOK Point: Watch the second video - Externalities.
Study this simple model of economics and annotate the 'externalities' that are mentioned in the video.
Should 'externalities' form part of future economic models? Write your notes on the sheet above.
Study this simple model of economics and annotate the 'externalities' that are mentioned in the video.
Should 'externalities' form part of future economic models? Write your notes on the sheet above.
|
Objective: To be able to describe the functioning of the atmospheric system in terms of the energy balance between solar and long wave radiation.
Starter: Your teacher will show you an image of the global energy budget .... for 20 seconds. Draw what you can remember! IB Essay Killer Opening Statement (copy and complete) The atmosphere is an _______ system, receiving radiation from both the sun and the ________. The energy of the earth is very _______ but it does have an effect in particular in urban climates. Incoming solar radiation is referred to as ________________ The main energy that drives all of our weather systems and our climate comes from the sun. The vast majority of this energy is absorbed at the __________ whereas energy is generally lost in the ________ regions. However, this energy is ______________ to higher latitudes by wind and air ________________. Choose from this key word list circulations open insolation earth equator redistributed polar small Task 1 - Key Words - Copy the key definitions and meanings to the right into your worksheet above. *Note the difference between the Greenhouse Effect & the Enhanced Greenhouse Effect*. The Atmospheric Energy Budget The earth and its atmosphere constantly receives solar radiation but there are long and short term variations in the earth's climate & recent decades have seen the general rise in global temperatures. This is global warming and will be covered a little later on in the unit. Task 2 - Using this website, make a copy of the diagram on the first page and use the text underneath it to make annotated (around the diagram) notes on how the energy budget works and transfers at each stage. Task 3 - Click here to be taken to Cool Geography. Read the information carefully on the page before completing **activity 3 only** on the space provided on your worksheet. |
Short-wave radiation is the energy from the sun that enters the earth's atmosphere (very short wavelengths) such as ultraviolet and visible light. Generally emitted by hot bodies.
Long-wave Radiation is the energy leaving the earth as infrared radiation at low energy and contains less energy than shortwave radiation. Generally emitted by cold bodies. Convection is the transfer of heat by movement of a gas or liquid Conduction is the transfer of heat by contact *Greenhouse Effect - Process where water vapour, C02, CH4 & CFCs allow SW energy from the sun to pass through the atmposhere and heat up the earth. However some of the resultant LW radiation is trapped leading to a heating of the earth. *Enhanced Greenhouse Effect occurs as a result of increased quantities of greenhouse gasses in the atmosphere owing to human activities and their impact on these fragile atmospheric systems. Want to know more about the functioning of the atmposhere and the difference layers? Check out this page full of great information and diagrams from 'The British Geographer' on his site here.
|
Terrestrial albedo changes and feedback loops... |

|
Like Daisies and animations? I hope so. Watch the video below to get out understanding started of the concepts of albedo and feedback loops.
|
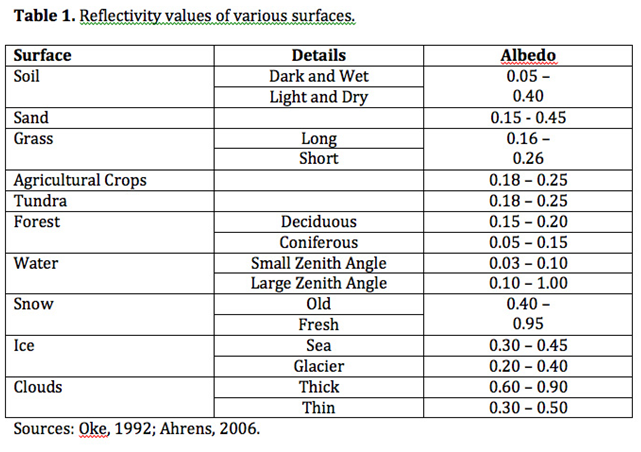
Albedo is the fraction of Sun’s radiation reflected from a surface. The term has its origins from the Latin word albus, meaning “white”.
It is quantified as the proportion, or percentage of solar radiation of all wavelengths reflected by a body or surface to the amount incident upon it. An ideal white body has an albedo of 100% and an ideal black body, 0%. Feedback loops - download this fact sheet to find out more. This image is also useful. Starter: Watch the video to the right. This is a one minute revision video on the ice albedo feedback. Make a note of the reflective values of ocean water and ice and look carefully at the reflectivity values in the table to the right. Now watch the second video from NASA that models what you have just been told. Task 1 - Using the worksheet below, complete the activities. Task 2 - Using all the resources in this section, complete the following IB question using this worksheet. Suggest two reasons for the global variations in albedo. (2+2) * Click on the images below to enlarge **Check out the snow coverage video from NASA at the bottom of this page and link to Albedo. |
|
|
|

|
Task 3 - Link together the last two lessons.
Complete the two questions by clicking on the tab beneath.
Complete the two questions by clicking on the tab beneath.
Solar radiation variations...
|
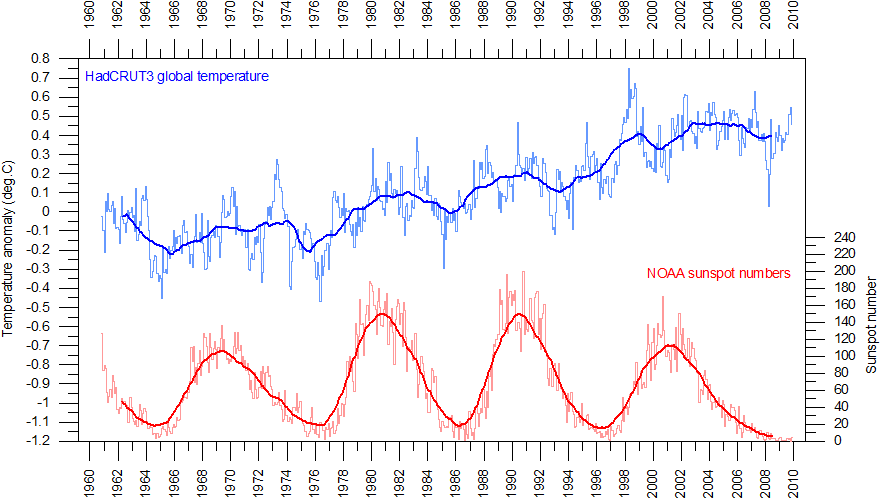
Task 1 - Conduct some research into sun spots, starting with the first video the right and find out how they are linked to the amount of short wave energy that the earth receives. The first video up to 2.25 gives you information on sun spots. The second video is a good source of information up until 1.25. Click on the graph below right to enlarge and take a copy before answering the questions below. Task 2 - Using the graph (below right), describe the pattern of sunspot activity between 1960 and 2010. Task 3 - Is there a relationship between sunspot activity and global temperatures (don't forget to look for anomalies) Task 4 - Click on this link from the BBC and print out and read the article carefully. i. What is the Maunder Minimum? ii. What is blocking? iii. Outline the impacts of sunspots on continental Europe and its populations. |
|

What is dimming? You might not have heard of dimming before. To explain in a very visual way, check out the slider images in this article from The Guardian.
The discovery of global dimming can be traced to Gerry Stanhill who was, in the 1950’s, a research worker studying irrigation water requirements. His task was to use climate measurements, in particular those of solar radiation, in order to determine the amount of water crops would require. He collected data for a year and his findings were used to design the national irrigation system. In the 1980s, he decided to repeat his studies to ensure that the data were still valid. He was astonished to find that there was a 22% reduction in sunlight reaching Israel. He knew that this was an enormous amount. Another scholar, Beate Liepert, was making similar observations over the Bavarian Alps. What was happening?
Liepert and Stanhill began to independently find similar data from around the world. All across the globe the amount of sunlight reaching the earth’s surface had seen a sharp decrease over the years. Between 1950 and 1990, there was a 9% decrease in Antarctica, a 10% decrease in the United States, a 30% decrease in Russia and a 16% drop in the British Isles. Stanhill aptly labeled the phenomenon “global dimming”.
It is thought that global dimming is probably due to the increased presence of aerosol particles in the atmosphere caused by human action. Aerosols and other particulates absorb solar energy and reflect sunlight back into space. The pollutants can also become nuclei for cloud droplets. Water droplets in clouds coalesce around the particles. Increased pollution causes more particulates and thereby creates clouds consisting of a greater number of smaller droplets. The smaller droplets make clouds more reflective, so that more incoming sunlight is reflected back into space and less reaches the Earth's surface. This same effect also reflects radiation from below, trapping it in the lower atmosphere (positive feedback).
|
|

|
An experiment by Dr. David Travis from the University of Wisconsin on airplane vapor trails provides a foretaste. To find out how big an effect the vapor trails were having on the amount of sunlight reaching the earth’s surface, he would have had to ground all of the planes in the sky on any given day and perform measurements. This nationwide landing of all flights never occurred, except for a few days after 9/11.
Travis burst into action and gathered temperature range records from weather stations from 48 states. The temperature range, which is the difference between the highest temperature during the day and lowest during the night, changes very slowly. Travis found that during the three days that flights were grounded across the US, there was a marked rise in the air temperature, presumably due to global dimming. During the grounding, the temperature range jumped by over one degree Celsius. It was the single largest temperature spike in the last 30 years. If just the removal of airplanes could cause this much of a temperature swing, scientists are worried that the overall effect of global dimming on world temperatures could be enormous.
Source: Huffington Post.
The levels of global dimming have decreased over central Europe and other parts of the developed world?
Task 1 - Watch the video above, taking notes on the worksheet. Pause at 2:57 and read this report from Science Daily. Once you have read the article and taken notes, please return to watching the video.
Dimming due to volcanic eruptions...
|
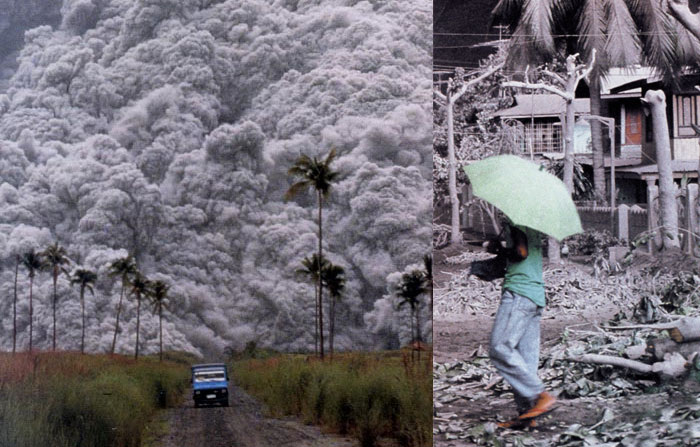
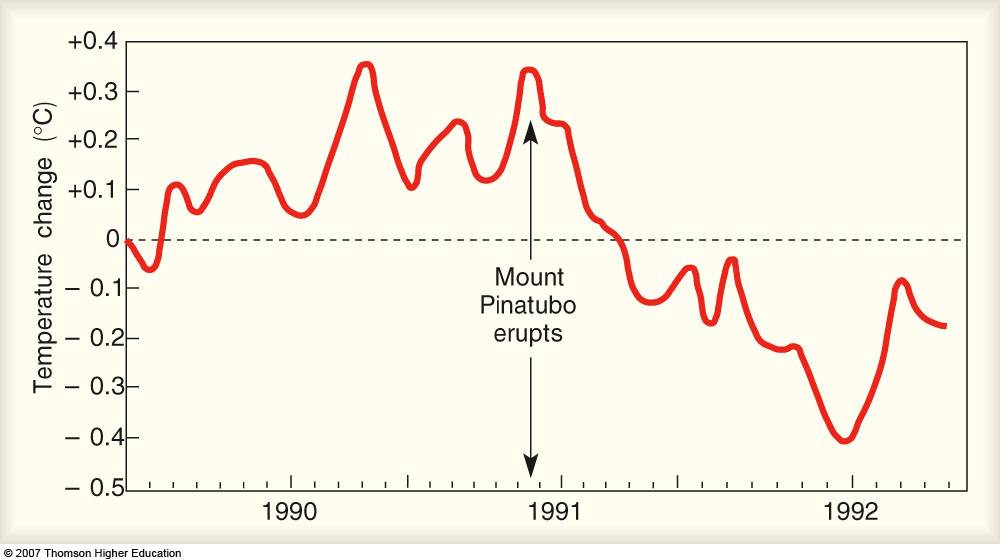
Focus: Mount Pinatubo. Eruption: 1991 in the Philippines. Familiarise yourself with this specific eruption by clicking on this link. Task 1 - Using the information within this Live Science Link, particularly focusing on the section entitled 'Pinatubo's global reach', the section above on Global Dimming and the graph below, take notes in the relevant section of your worksheet above. |
|
|
|
|
Methane gas release and feedback loops... |

|
|
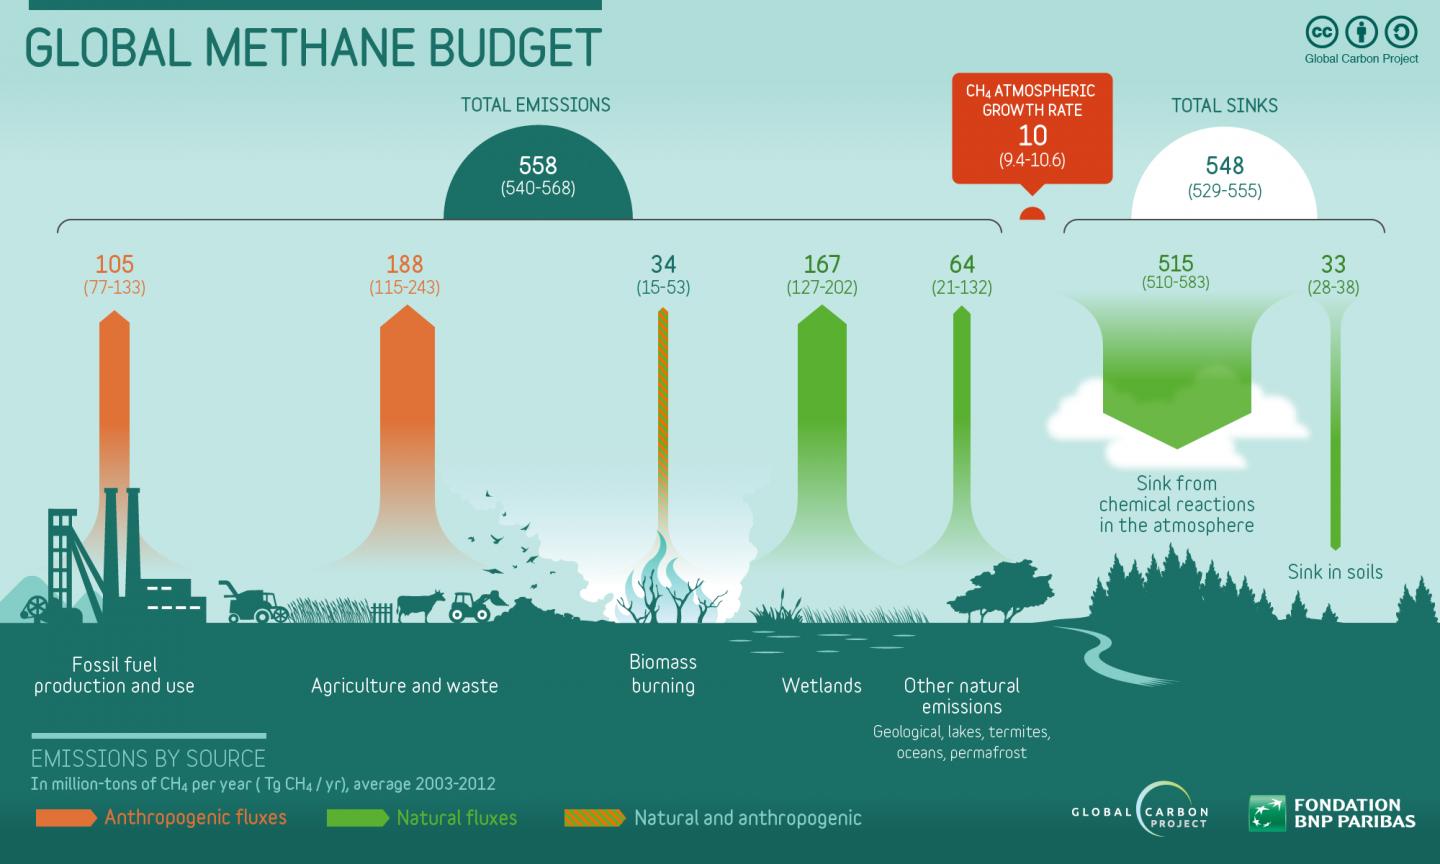
Methane is a chemical compound with the chemical formula CH4 (one atom of carbon and four atoms of hydrogen). It is a group-14 hydride and the simplest alkane, and is the main constituent of natural gas. The relative abundance of methane on Earth makes it an attractive fuel, though capturing and storing it poses challenges due to its gaseous state under normal conditions for temperature and pressure. Natural methane is found both below ground and under the sea floor. When it reaches the surface and the atmosphere, it is known as atmospheric methane. The Earth's atmospheric methane concentration has increased by about 150% since 1750, and it accounts for 20% of the total radiative forcing from all of the long-lived and globally mixed greenhouse gases. (Wikipedia 2017) Task 1 - Read the information above and watch the video to the right. In your own words, explain how methane contributes to global warming via positive feedback. Pay particular attention to its links with ice melt as studied previously. Task 2 - Spend 10 minutes learning about permafrost melt by using this excellent interactive graphic from Reuters. Then, read this article from the BBC and make notes on your worksheet above. |
|
|

|
|
Task 1 - Using the video above, the video to the right as well as the three spatial data sets in the space below (click on full screen to maximise view), create a piece of commentary that addresses the international variations in greenhouse gas sources and emissions. You may structure it using the 4P's approach
1. Place - Which countries emit the largest/smallest quantities of C02? Use this graphic in your analysis. Can they be categorised by level of economic development? Are there differences between overall emissions and those per capita? 2. Processes - How are these emissions created? Do the emissions just affect the emitting countries or are there processes in place that disperse the problem? What's the link to the Enhanced Greenhouse Effect? Think globalization & trade. 3. Possibility - Future patterns in emissions and targets (SDG's) to reduce emissions and reduce impacts on MIC's & LIC's. 4. Power - Those that aim to change these patterns (think SDG's, Climate Change Deals etc) as well as those governments who are promoting economic growth through industrialisation and processes of globalization. |
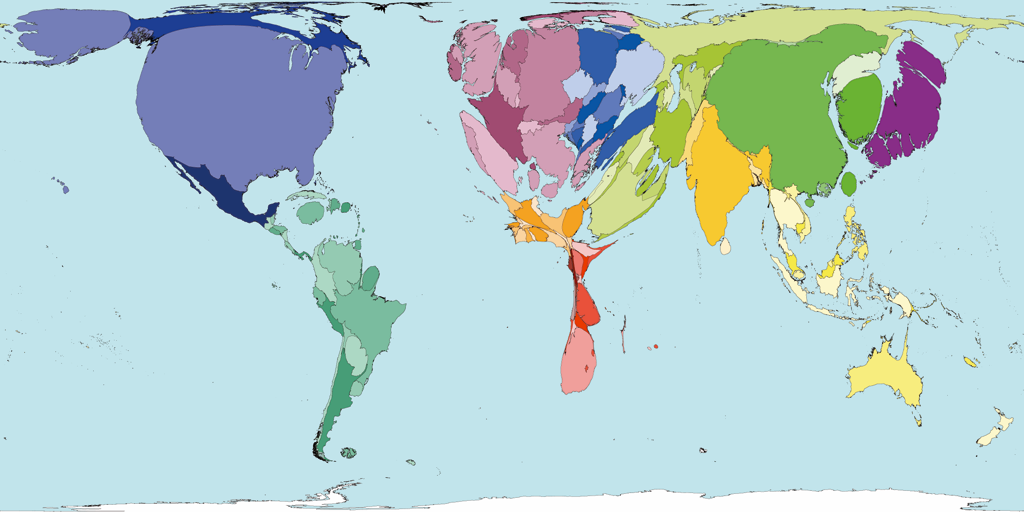
Source: Worldmapper.org
|
|
|
|
|