
What you'll need to know...
KEY CONCEPT - How political, technological and physical processes influence global interactions
Political factors that affect global interactions:
• multi-governmental organisations (MGOs) and free trade zones
• economic migration controls and rules
Our “shrinking world” and the forces driving technological innovation:
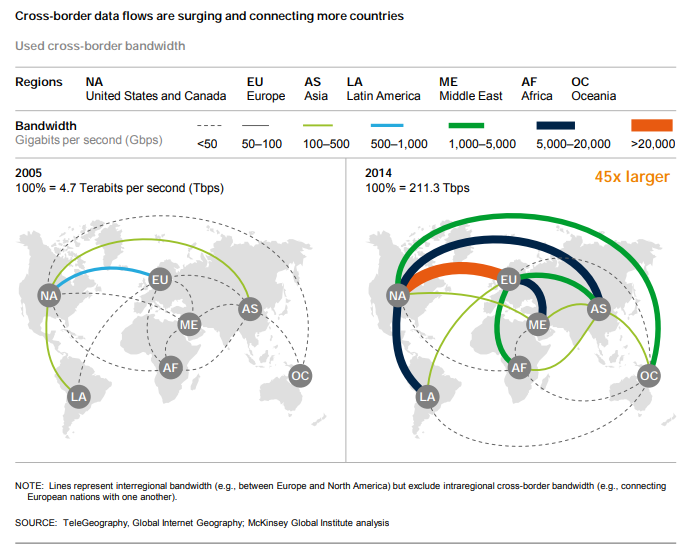
• changing global data flow patterns and trends
• transport developments over time
• patterns and trends in communication infrastructure and use
The influence of the physical environment on global interactions:
• natural resource availability
• the potentially limiting effect of geographic isolation, at varying scales
Synthesis, evaluation and skills opportunities
How processes that influence spatial interactions are interlinked in complex ways that accelerate globalization
Political factors that affect global interactions:
• multi-governmental organisations (MGOs) and free trade zones
• economic migration controls and rules
Our “shrinking world” and the forces driving technological innovation:
• changing global data flow patterns and trends
• transport developments over time
• patterns and trends in communication infrastructure and use
The influence of the physical environment on global interactions:
• natural resource availability
• the potentially limiting effect of geographic isolation, at varying scales
Synthesis, evaluation and skills opportunities
How processes that influence spatial interactions are interlinked in complex ways that accelerate globalization
Political factors that affect global interactions...

|
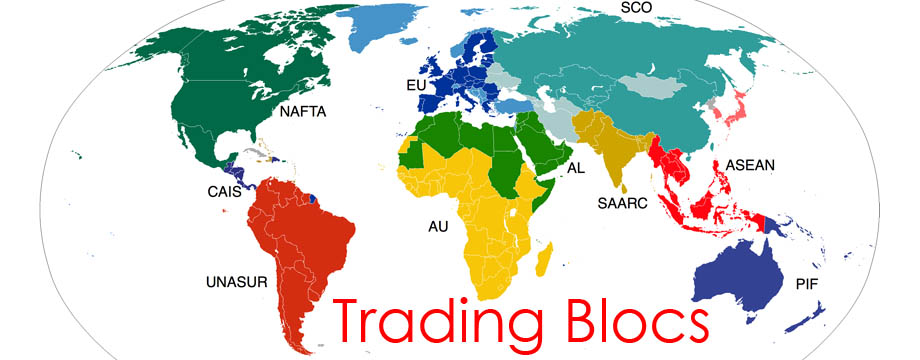
Multi Governmental Organisations - Case Study EU Task 1 - Using the first video to the right, create a timeline of the major developments in the creation of the EU from 1950 to the present day. Include Brexit, which has since happened. There is also some additional information about 1/3 of the way down this page. Task 2 - Outline the main functions of the European Union. To do this, watch the second video to the right. Task 3 - Note down what you think are the four biggest advantages & disadvantages of EU membership by clicking on the table below (it will enlarge). 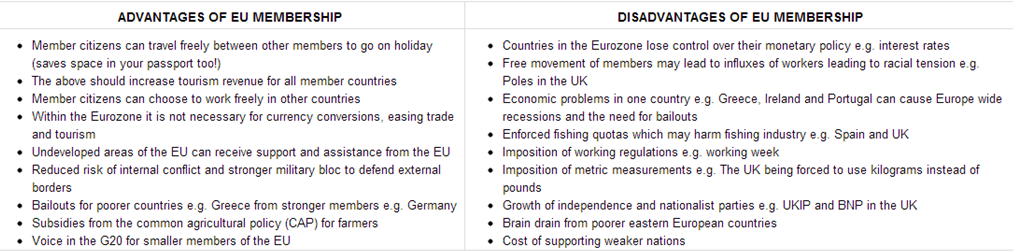
Task 4 - Watch the third video below, right. Make notes on what Free Trade Zone (FTZ) is and how this differs to a Free Trade Area and a Customs Union. Task 5 - Complete the tasks on the worksheet below (thanks to geographyalltheway.com). This Wikipedia link will help. So, how does this look elsewhere? In North America, there appears to be a more simple model consisting of the USA, Canada & Mexico. It is called NAFTA (the North American Free Trade Association) |
|
|
Carry out some additional research to find out why President Donald Trump wanted to renegotiate the NAFTA deal.
This link will help. The last video the right gives you a flavour of his thinking during his presidency! 
|
|
Economic migration controls and rules...

Define: Economic Migrant
An economic migrant is someone who emigrates from one region to another to seek an improvement in living standards because the living conditions or job opportunities in the migrant's own region are not sufficient.
In your lifetime you have been witness to many well documented economic migrations. The traditional case study of Mexican migrants into the USA is a famous example and the new detention centres and separation policy introduced by the previous Trump administration have added new dimensions to the issues.
We have also seen movements of millions of people from the Middle East (Syria) and North Africa displaced by war and political unrest and seeking a new life and economic prosperity in the European Union. Germany has been a big recipient country with over 1,000,000 migrants arriving in 2016 alone. Other flows exist such as European workers to Australia to take advantage of a strong economy, higher quality of life and looking to escape from austerity.
For this brief study, we will look at economic migration controls and rules on the Mexico - USA border and further afield.
Background Research - Watch the VOX video above that traces the history of migration in the United States since a key bill (IIRAIRA) was passed by then President, Bill Clinton.
|
|
|
Research - Take notes on the Vox documentary video. Focus on:
1. Why people move.
2. How they move.
3. The dangers to migrants.
4. Explain the issues at the northern and southern Mexican borders.
5. How do the USA apply pressure on Mexico to stop the flow & why does Mexico comply?
Now watch the Wall Street Journal report on the construction of the USA / Mexico border wall (both above).
6. Explain the thinking behind the construction of the Border wall.
7. What are the limitations of such a scheme?
Read this White House press release from January 2021:
8. Explain briefly what the President Biden is doing in relation to the border wall.
9. Update from 2023/2024 - Watch the first video below that shows the impacts of uncontrolled migration on the Mexico / USA border. Note the section of the report where the US official is visiting Honduras (a long way from the border).
10. Watch the second video (Feb 2024) to take notes on the new Bill and what it aims to control.
|
|
|
More info here
|
|
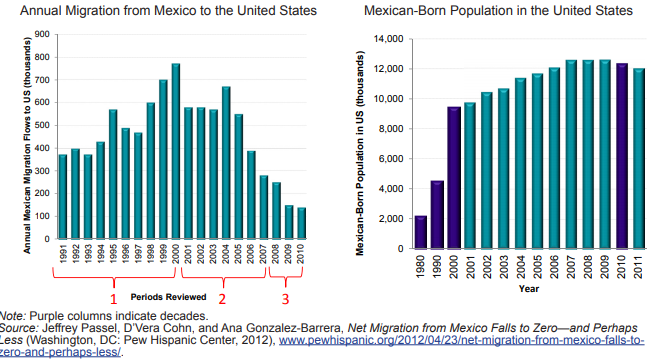
Task 1 - Using the first two graphs above, describe the pattern of annual migration from Mexico to the United States since 1997.
Task 2 - Why does the flow decrease rapidly in 2001, 2002 & 2003?
Task 3 - Describe the trend in the second graph in the Mexican born population in the USA. What does this suggest is now happening?
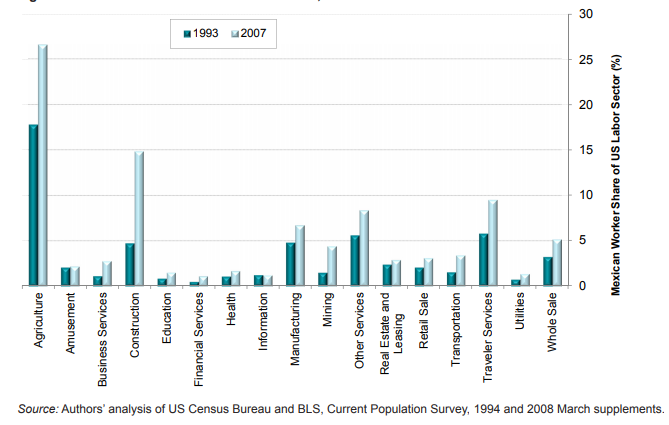
Task 4 - The third graph above shows Mexican workers by employment sector in the USA. Describe the changes from 1993 to 2007.
Task 5 - Suggest reasons for the three sectors that employing the highest proportion of Mexican labour.
Task 2 - Why does the flow decrease rapidly in 2001, 2002 & 2003?
Task 3 - Describe the trend in the second graph in the Mexican born population in the USA. What does this suggest is now happening?
Task 4 - The third graph above shows Mexican workers by employment sector in the USA. Describe the changes from 1993 to 2007.
Task 5 - Suggest reasons for the three sectors that employing the highest proportion of Mexican labour.
The Shrinking World...
|
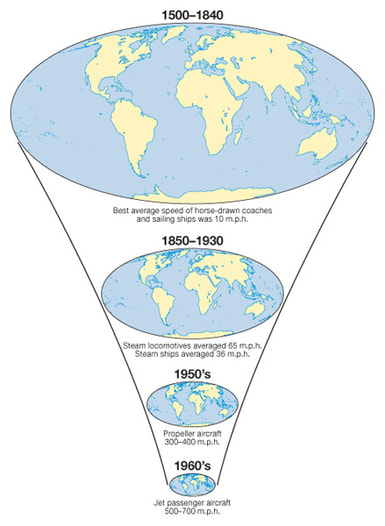
Need to know .... The Shrinking World.
Friction of Distance This is the reduced likelihood of people using a service the greater the distance that they live from it. Distance is an issue due to the time and costs to overcome it. e.g. reduction in commuting to IST with increasing distance from Colomiers. Friction of distance is closely related to transportation and accessibility. Time-Space Convergence This is when travel time between places decreases and distance declines in terms of its significance. It is generally brought about by transport innovations and improvements e.g. Airbus A380 can fly London to Perth in just 21 hours in 2018. Task 1 a. Watch the video (IB Geography Globalization) below. Make notes on each of the factors that James May claims to have "made the world a smaller place". b. Which factor do you think has been the most influential in shrinking our planet? |
|
Transport developments over time...
|
|
To complete this work, you will need to use the worksheet below. It contains the links to the video resources you will need. Your aim to to take notes and carry out research that will enable you to answer the exam question below:
Describe and explain the changes in speed and capacity in transport over time. (12)
|
|
|
|
Patterns & Change in Communication Infrastructure...
Preparation Learning Task - Watch the videos below in preparation for the lesson. Choose the one that matches your prior understanding!
Who Invented the Internet?
Please use either of the worksheets below to complete this short unit of analysis.
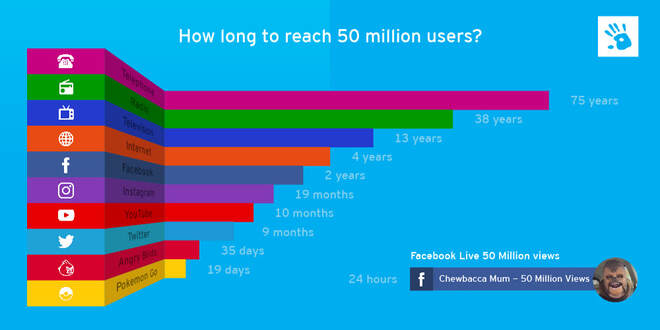
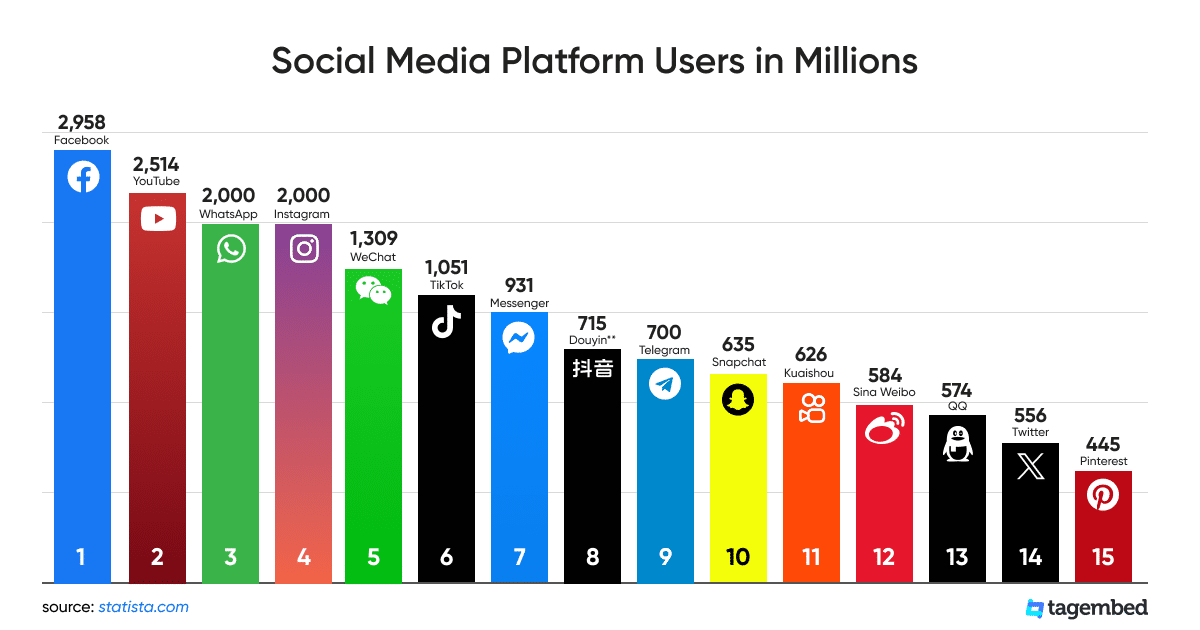
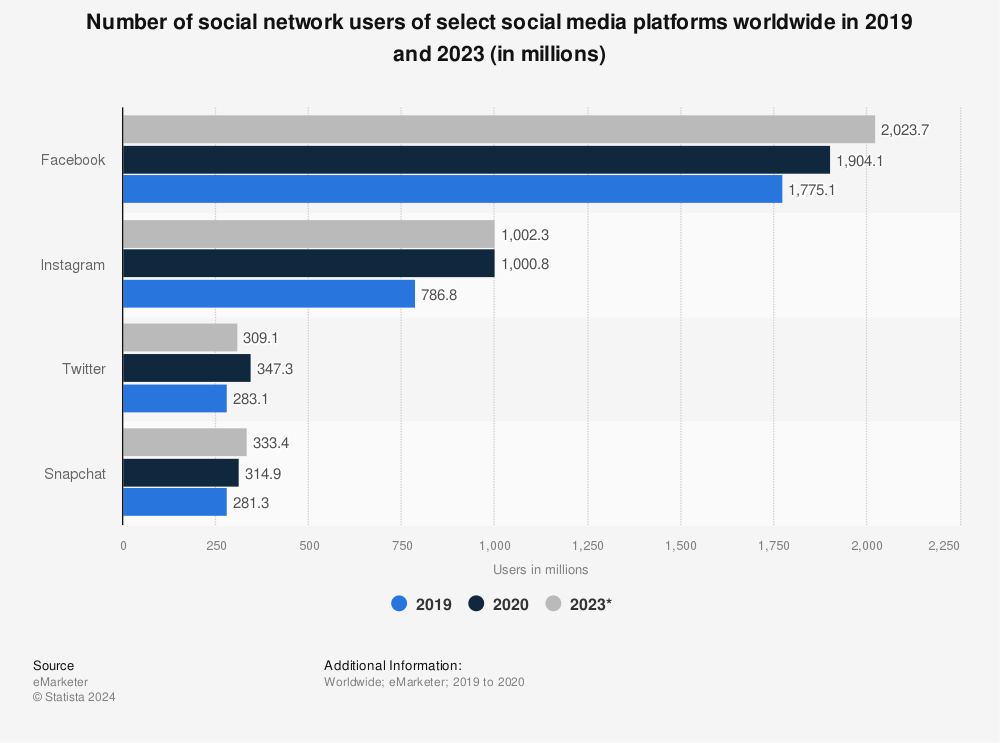
Starter: Comment on the trends shown in the charts above on your worksheet. Write a 50 word summary to describe the growth in global connectivity as well as the rise of social media and reaching the 50 million user mark. Use the information from 2015 on your worksheet and compare that to the increase numbers of active users in the first chart for 2023 below.
|
|
Task 1 - Study the six charts below carefully. It shows the patterns and trends in communication infrastructure over time. The left hand column shows the data for around the time you were born. The right hand column is the latest data (Source: World Bank). You can drag around the map as well as zoom in and when you hover over a country, it will give you the data for that year (per 100 people).
Task 2 – Compare the quantity and quality of communication technology between the three countries in your table.
Task 3 - What processes play a part in how technologically advanced these places are? (synthesis)
|
|
|
Influence of the physical environment on global interactions...
Task 1 - You are going to complete a short piece of analysis to explain how the influence of the physical environment effects global interactions.
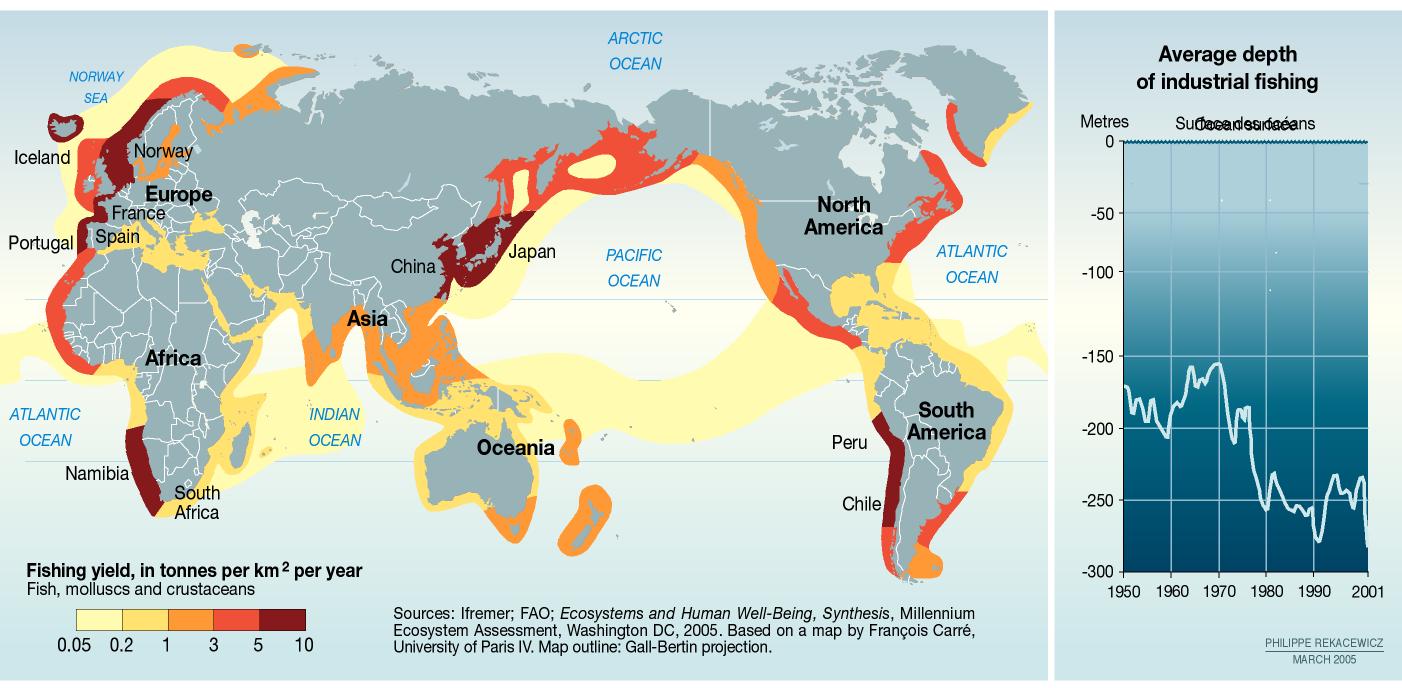
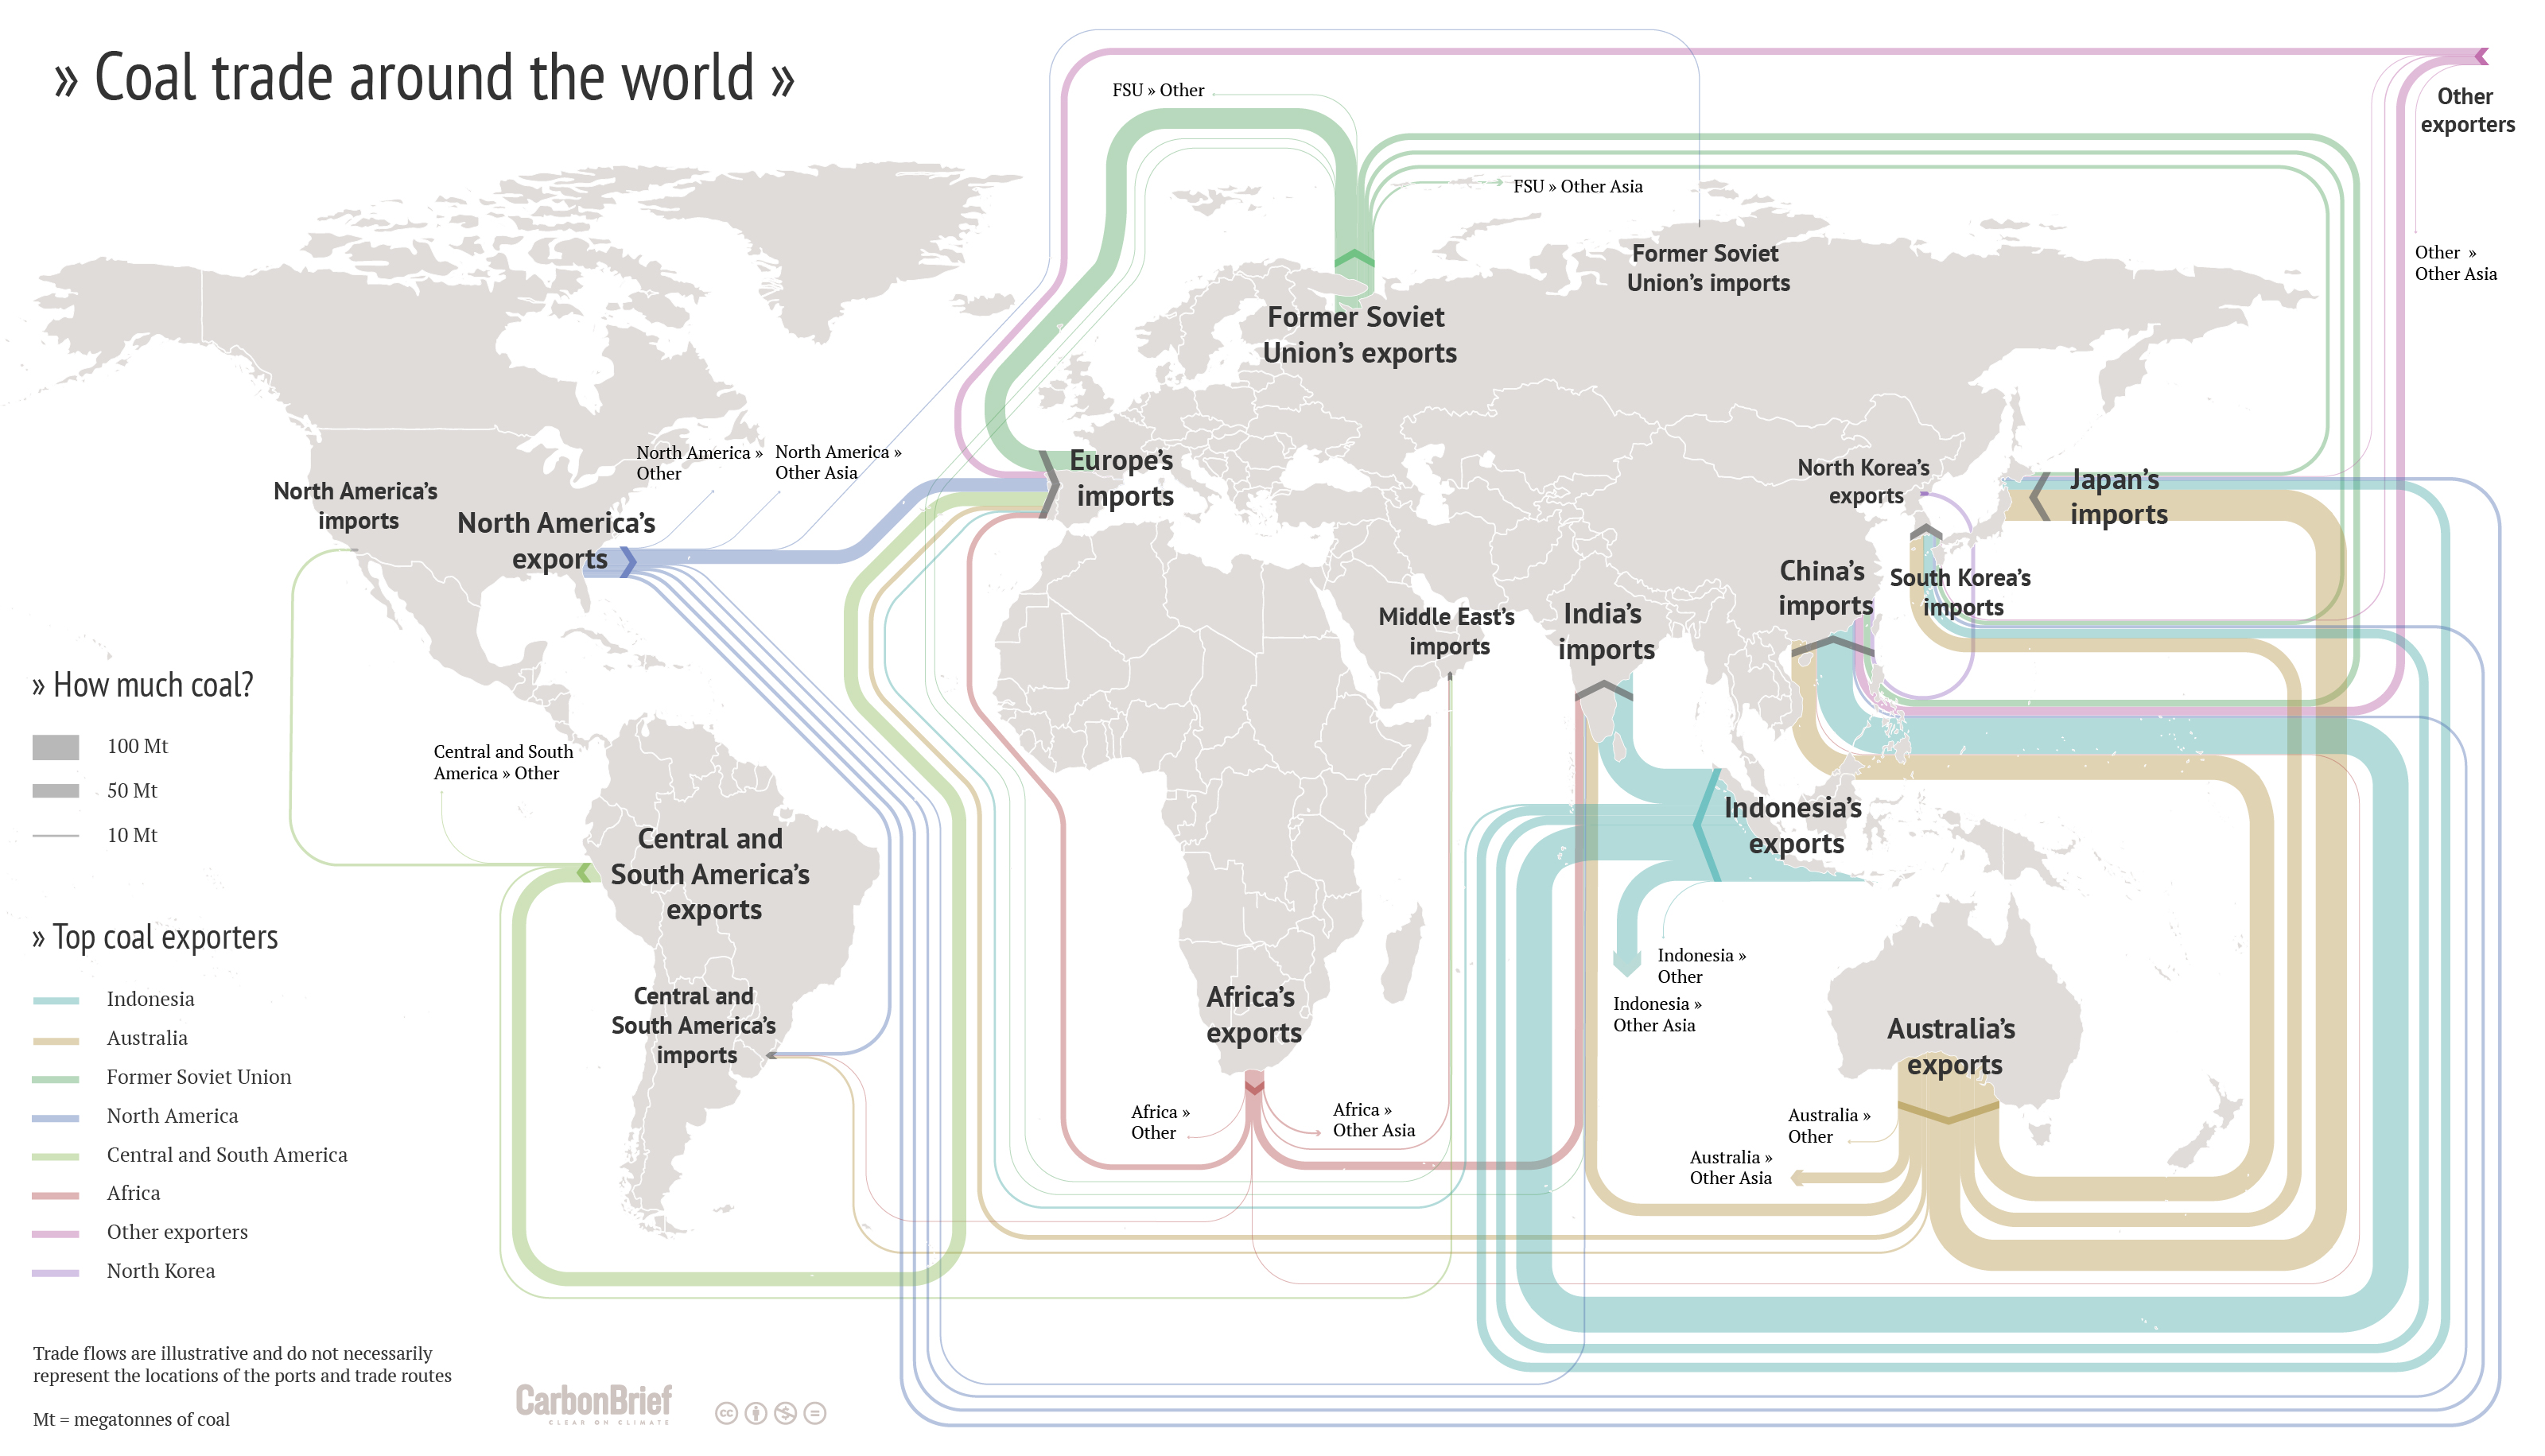
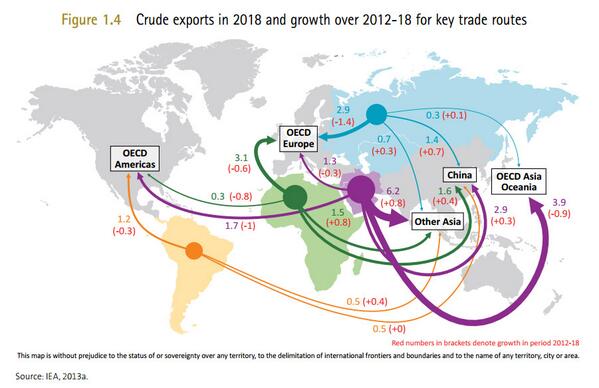
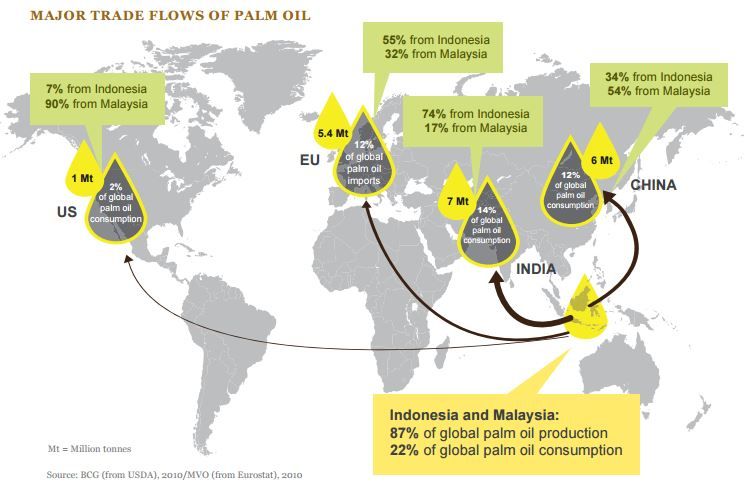
Choose any two of the four category maps below and complete a piece of analysis that explains the origins of the natural resource, the human need for that resource and the process by which this interaction takes place (between places). You can use the worksheet below.
If you click on the map, it will enlarge so that you can see a better level of detail.
|
1. Physical Environment & Fishing

3. Physical Environment & Coal

|
2. Physical Environment & Oil

4. Physical Environment & Palm Oil

|
Geographic Isolation
On a printed out copy of this newspaper article from the Irish Independent, highlight the impacts of being a landlocked and therefore possibly remote country on people and the economy. Use the infographic below to help too.
|
|

|