What you'll need to know...
KEY CONCEPT - Population possibilities and power over the decision-making process
Global and regional/continental trends in family size, sex ratios, and ageing/greying
Policies associated with managing population change, focusing on:
• pro-natalist or anti-natalist policies
• policies related to ageing societies
• gender equality policies and anti-trafficking policies
The demographic dividend and the ways in which population could be considered a resource when contemplating possible futures
• One case study of a country benefiting from a demographic dividend
Synthesis, evaluation and skills opportunities
How population change may affect the power balance between groups of people at local, national and international scales
Family size...
Family size may be measured using household data. A household is a group of persons who make common provision of food, shelter and other essentials for living. Households are at the centre of many demographic, social and economic processes, since decisions about childbearing, living arrangements, education and health care, labour force participation, migration and savings often are made at the household level.
The characteristics of households, including their size and composition, are closely associated with sustainable development, poverty and well-being in general, as well as with patterns of consumption are shaping the human impact on the environment. (Source)
The characteristics of households, including their size and composition, are closely associated with sustainable development, poverty and well-being in general, as well as with patterns of consumption are shaping the human impact on the environment. (Source)
Task 1 - Download the UN report below and complete the following questions.
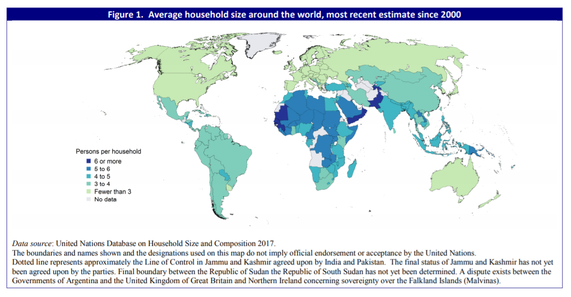
a. Using the graphic above (and on the report), describe the distribution of household size around the world.
b. Describe the pattern of household size in France since the 1960's.
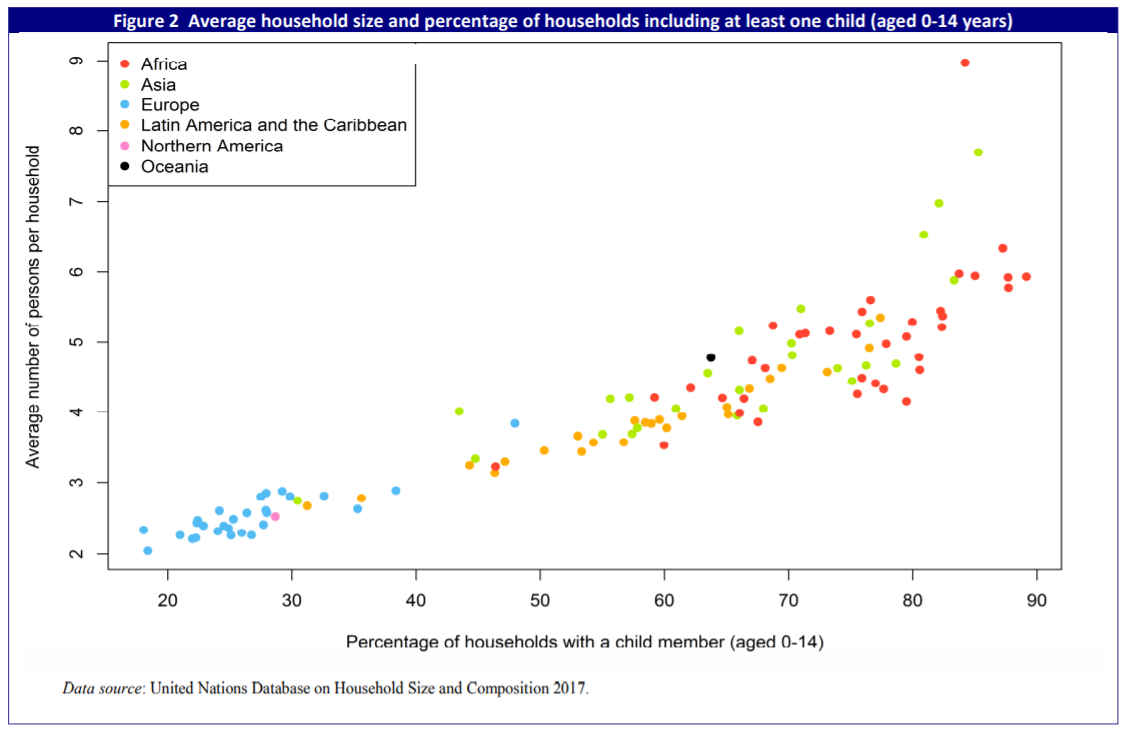
c. Using the second graphic above, describe the link between level of economic development and household size.
d. What is the relationship between household size and fertility?
e. Study Figure 3 and describe the parental make-up of households around the World?
f. Explain how household size can affect a country's ability to meet different SDG's.
Sex Ratio...
|
In anthropology and demography, the human sex ratio is the ratio of males to females in a population. More data are available for humans than for any other species, and the human sex ratio is more studied than that of any other species, but interpreting these statistics can be difficult.
The sex ratio for the entire world population is 102 males to 100 females (2017 est.). Gender imbalance may arise as a consequence of various factors including natural factors, exposure to pesticides and environmental contaminants, war casualties, sex-selective abortions, infanticides, aging, and deliberate gendercide. |
|
Task 2 - Describe the global trend of sex ratio and suggest reasons for the heightened imbalance in China and the UAE.
Task 3 - Read this article from the BBC and explain why Sweden has an ever larger imbalance than China.
Extension - Click here to read about the issues caused by sex-selective abortion in Armenia. Take some notes on the impacts of this activity on the demographics of the country.
Ageing / Greying...
From issues such as declining fertility rates to the ongoing complications resulting from China’s famous “One Child Policy”, there are many demographic challenges that the world must grapple with in the coming years.
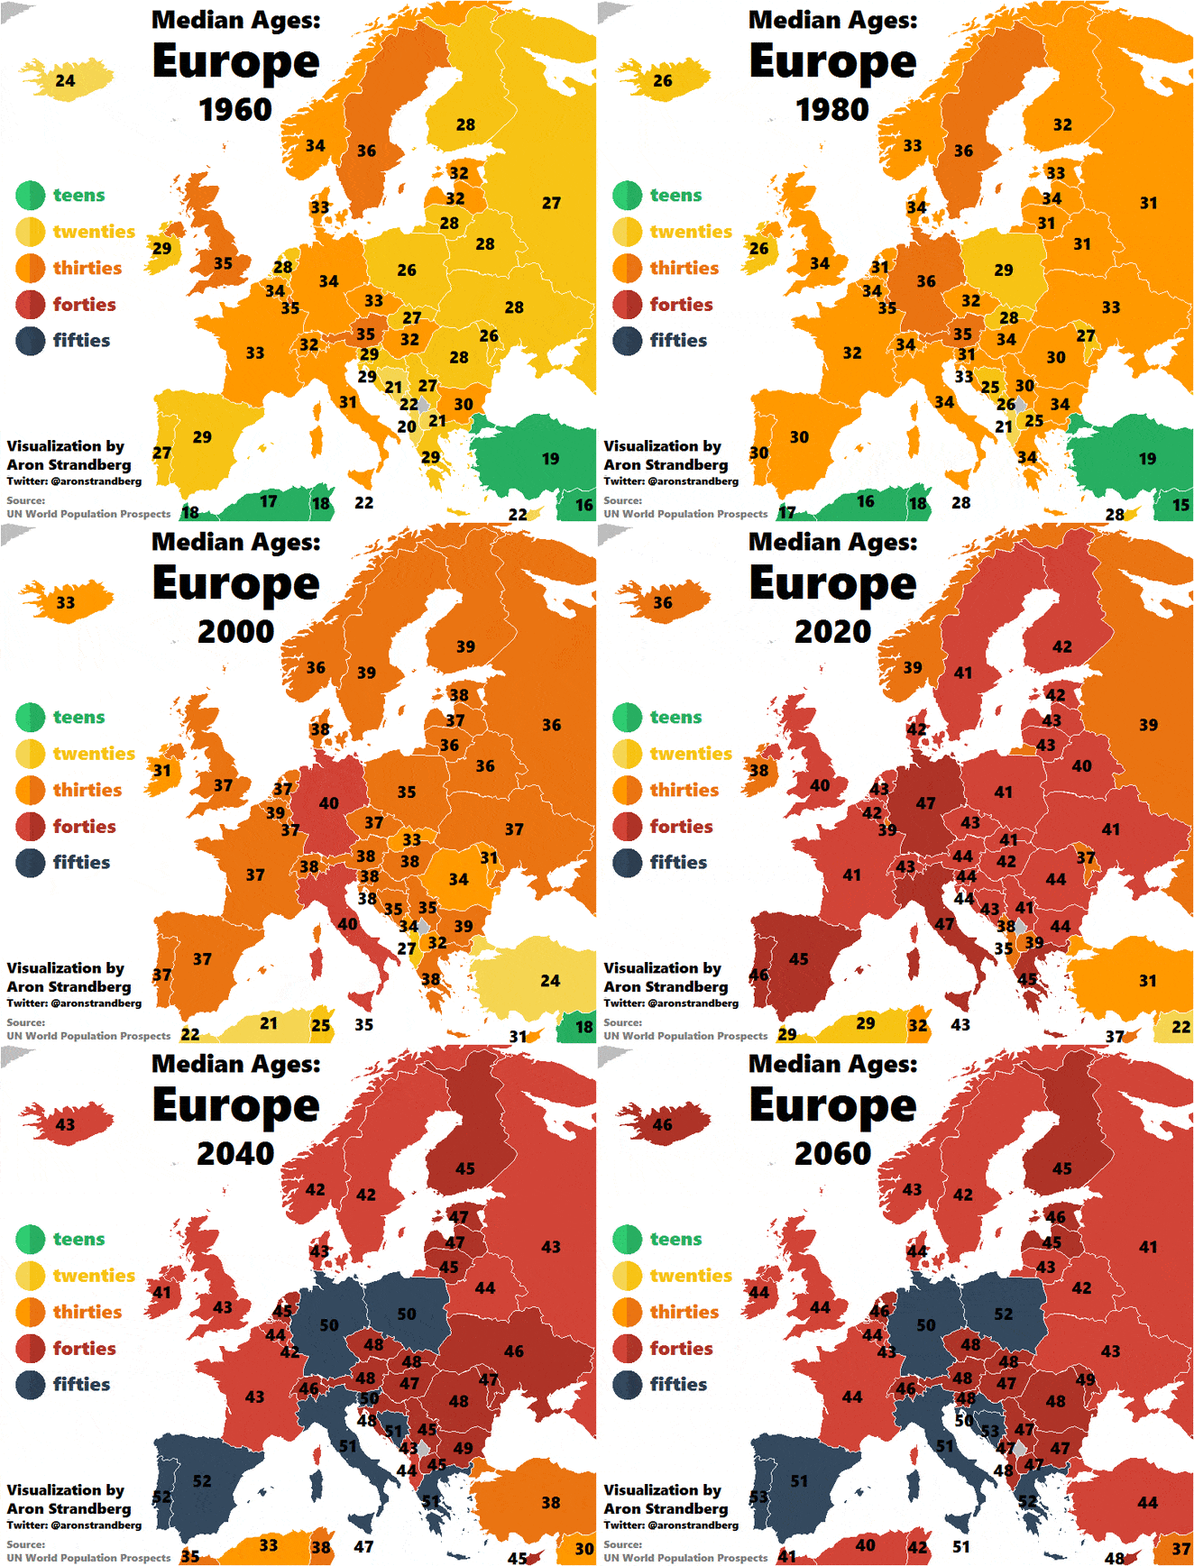
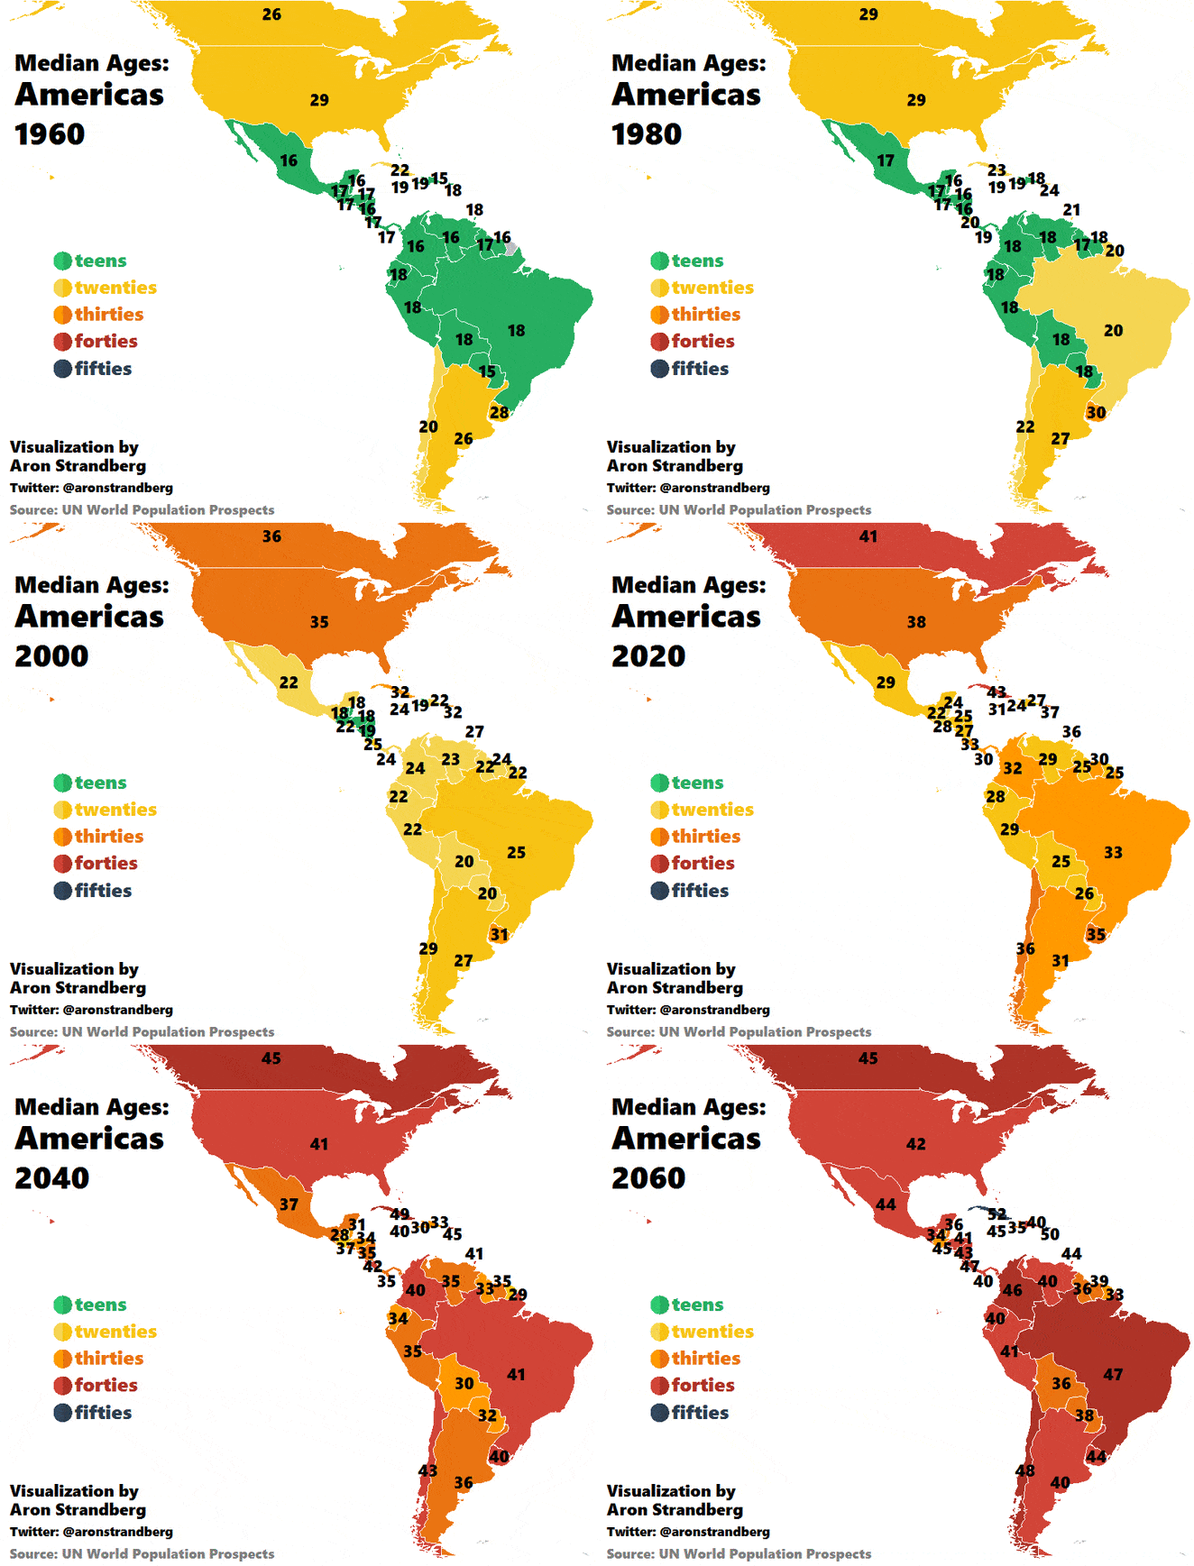
However, one problem of particular importance – at least in places like Europe and the Americas – is a rapidly aging population. As the population shifts 'greyer', potential consequences include higher dependency ratios, rising healthcare costs, and shifting economies and cities. (source)
Task 4 - Click here to be taken the The Visual Capitalist website and an excellent interactive article on Ageing Populations. Check out the different characteristics and then complete a piece of commentary describing the spatial distribution of ageing / greying being sure to explain this spreading trend.
Take a note of the data for both France, Ethiopia and China for the three different date ranges.
This next unit of work discusses how population change may affect the power balance between groups of people at local, national and international scales.
We will split into four groups, each group taking one of the following case studies to present to the class.
Group 1 - Pro-natalist Policies...
Do it for Denmark!
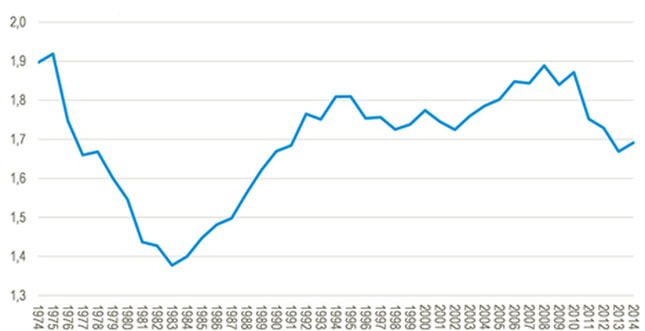
Denmark, like many other European countries has seen a decline in its overall fertility rates since the baby boom of the 1960's. These falling fertility rates have been caused by an increase by the continued empowerment of women and advanced family planning schemes. The graph below shows the patterns and trends of the Danish fertility rate since the mid-1970's.
Task 1 - Describe the pattern of fertility rates in Denmark since 1974 and state the three highest points it has reached (and the years).
To combat this below replacement level fertility issue, the Danish government have launched a number of initiatives to encourage their population to reproduce more.
Task 2 - Read this article and take notes on the scheme of teaching Danish students to have more babies.
Task 3 - Read this article and take some notes on why the residents of the Danish town of Thy have been encouraged to do their bit to help!
Denmark then took this policy one stage further than most other countries would dare to and released a series of adverts making it very clear what the only solution to the fertility problem was ...... and encouraging their population to get to work to solve the problem!
|
|
|
Task 4 - Watch both videos carefully. Remember that this is good Geography and take notes on the methods used to encourage people to have more children.
Task 5 - Read this review of the campaign from The Independent and make notes on the successes of the 'Do it for Denmark' campaign.
Group 2 - Ageing Society Policy...
Situation in the EU
The total population in the EU is projected to increase from 511 million in 2016 to 520 million in 2070. However, the working-age population (people aged between 15 and 64) will decrease significantly from 333 million in 2016 to 292 million in 2070. These projected changes in the population structure reflect assumptions on fertility rates, life expectancy and migration flows.
The old-age dependency ratio (people aged 65 and above relative to those aged 15 to 64) in the EU is projected to increase by 21.6 percentage points, from 29.6% in 2016 to 51.2% in 2070. This implies that the EU would go from having 3.3 working-age people for every person aged over 65 years to only two working-age persons. (source)
Why we should take care with ageing?
The longevity effect is essentially a measure of how biological aging has changed in relation to chronological age. One consequence of this change is that the standard chronological measure of age makes less sense than ever. In the US, a 75-year-old today has the same mortality rate as a 65-year-old in 1952. Similarly, in Japan, 80 is the “new 65.” As an actuarial matter, then, today’s 75-year-olds are not any older than the 65-year-olds of the 1950s.
However, we should be careful not to treat ageing as a stand alone problem and must move away from nominal measures of age that treat older people as a problem. Perhaps it is time to stop worrying about “ageing societies” and start focusing on the type of demographic change that really matters. Some might say that governments should provide those in a position to reap the benefits of longer, healthier lives with opportunities to do so, while minimizing the number of people who are denied longevity. By investing in a longevity dividend, countries can reduce the supposed threat of an ageing society.
|
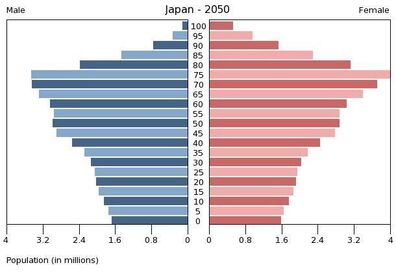
Task 1 - Read the next above carefully and make notes where necessary. Task 2 - Study the graph to the right. i. What it the total growth of persons over the age of 65 between 1980 and 2050 (projected)? ii. Where is highest growth area in terms of persons over the age of 60 years old? Why might this be? We are now going to focus on a country that has long identified has having to deal with a rapidly ageing society. The video below is a short documentary focusing on Japan and its policies to deal with this issue. The Age/Sex structure for Japan below highlights the complex issues that the country faces. Task 3 - Take notes on the issues faced in Japan and how the country aims to effectively deal with this demographic issue. |
|
Group 3 - Gender equality policies...
|
|
|
You will have seen much in the news recently about the disparity between wages between men and women in similar employment positions. This has resulted in protest actions such as the 'Equal Pay Day' movement which is the time in the year where women effectively stop earning relative to men because of the gender pay gap.
Iceland has recently become the first country to outlaw this wage disparity.
Task 1 - Watch the first video above and take notes on their policy.
Task 2 - Watch the second video about and comment on why the supposed gender pay gap might be misleading.
Task 3 - Read this article from the BBC and take further notes on the effectiveness of this sort of policy and where else it may be rolled out. You may also want to check out the 'Company Calculator' (IST students - try Airbus).
Group 4 - Anti Trafficking Policies...
|
.
|
**Some graphic content at the start of the video above**
|
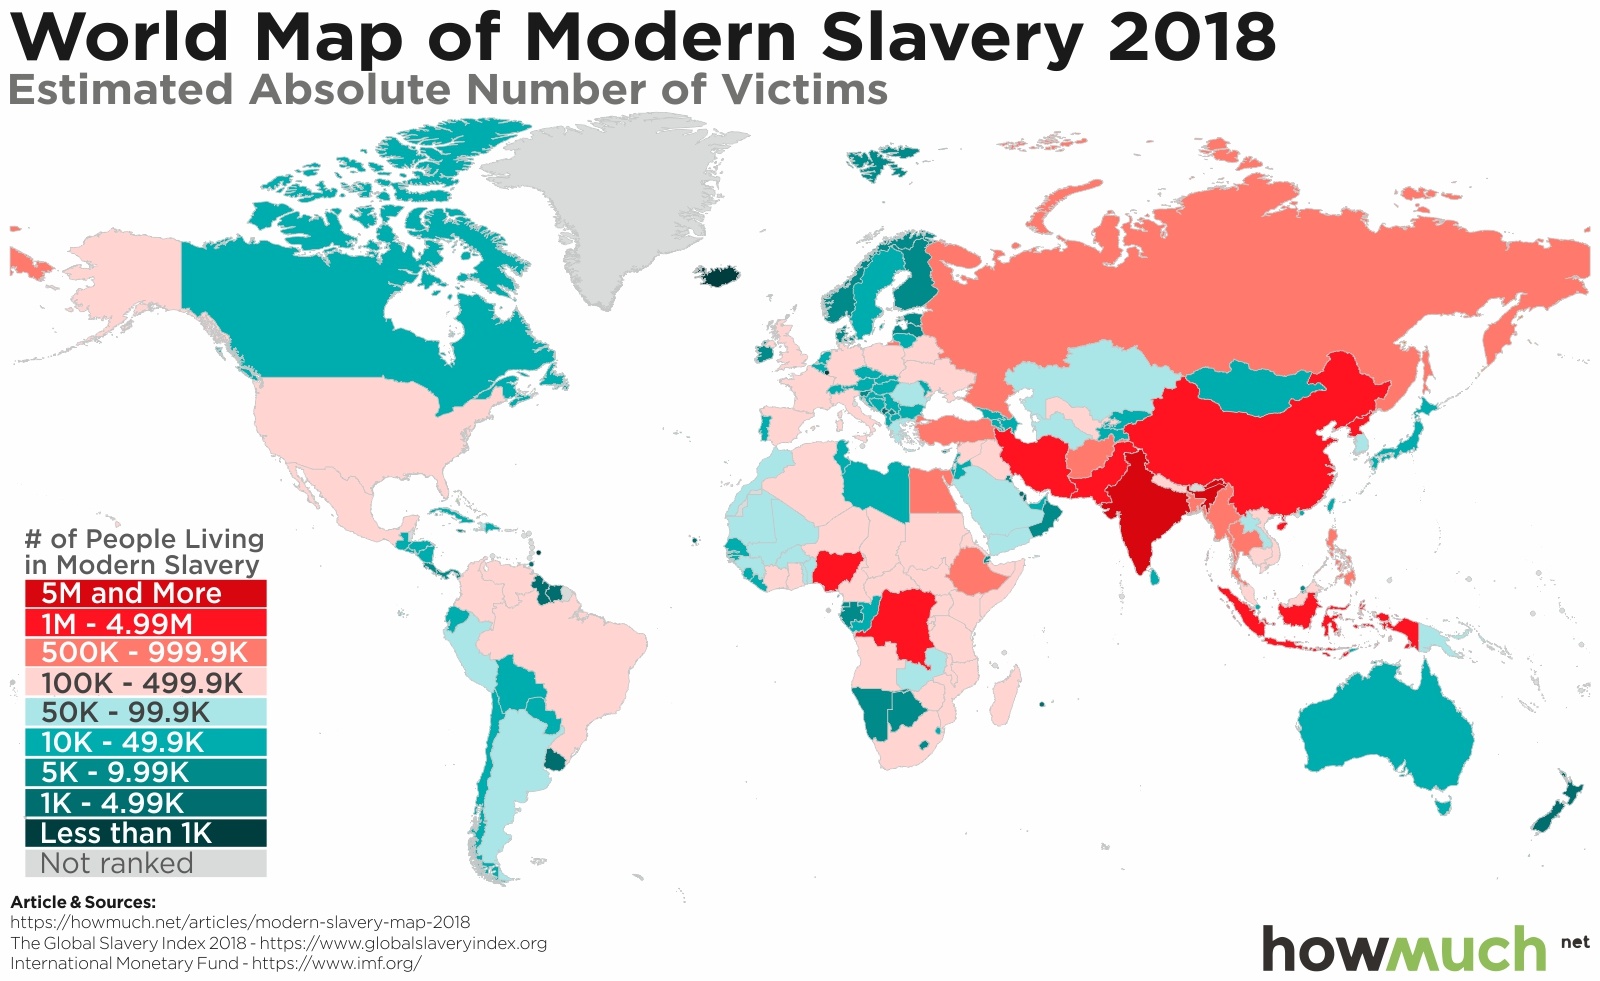
Above are two examples of policies relating to the prevention of trafficking of people in two contrasting locations, the UK and USA. The first example is from Kent in the south of England with a campaign that aims to alert people to the presence of trafficked people in vulnerable jobs. The second follows a human trafficking survivor in San Diego.
Task - Choose either of the two case studies and take notes ready to feedback to the group on the causes and effects of this illegal movement of people. You should also comment on the successes of the policies implemented in order to safeguard the vulbnerable people caught up in the illegal operation.
Task - Choose either of the two case studies and take notes ready to feedback to the group on the causes and effects of this illegal movement of people. You should also comment on the successes of the policies implemented in order to safeguard the vulbnerable people caught up in the illegal operation.
The Demographic Dividend...
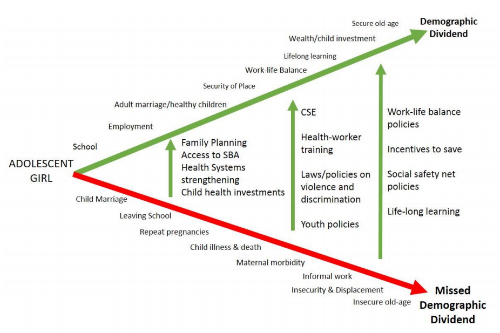
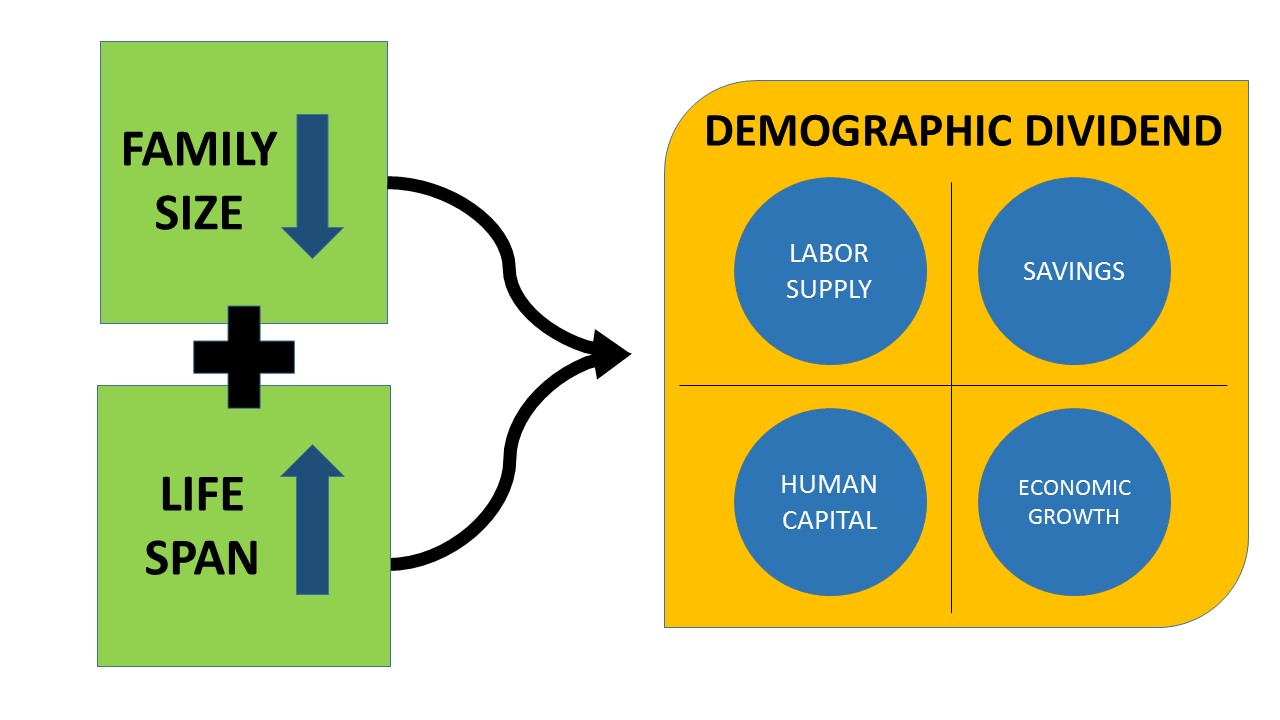
"Demographic dividend" - The ability of a young and active workforce to catapult economies out of poverty as fertility and mortality decline
|
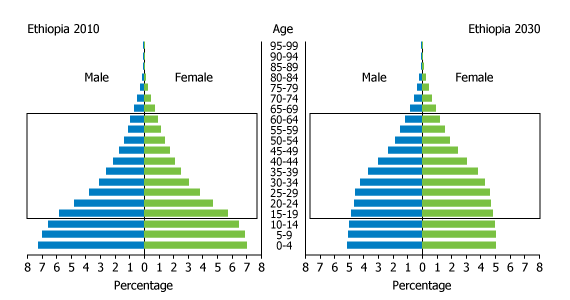
This last piece of work in the population unit will be taking us to Ethiopia again to study the impacts of the demographic dividend on the country. IB requires a brief case study of the impacts of the demographic dividend on the country. Task 1 - Click here to be taken to a site that explains the concept of the demographic dividend in more depth. Complete the activities on the worksheet. You may also use the longer video to the right as an additional source of information and to broaden your understanding. i. Define the term demographic dividend. ii. Outline four benefits of the demographic dividend. iii. What may stop a country from benefiting from the demographic dividend? Task 2 - Click here to be taken to a summary of the demographic dividend in Ethiopia. Complete the activities on the worksheet as instructed.
|

