
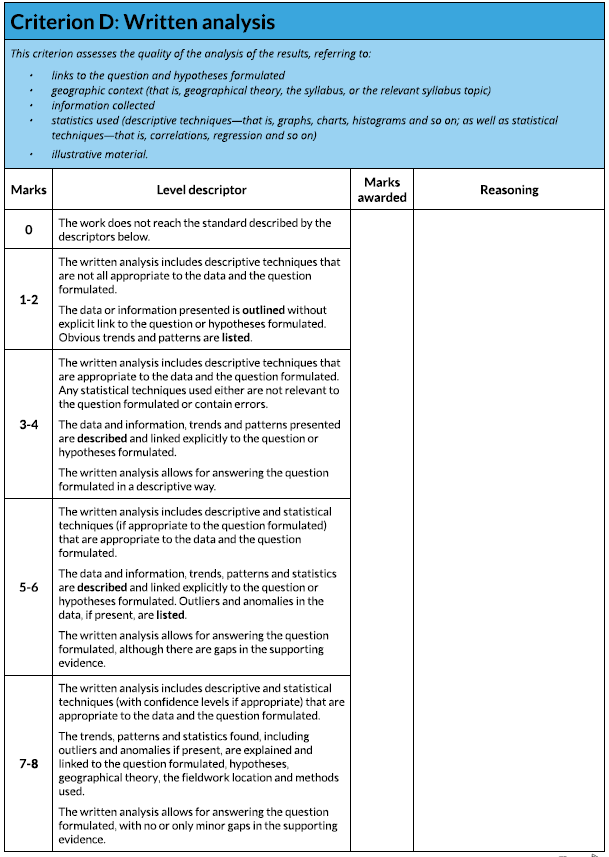
Written analysis...
8 marks available
Suggested word count of 850 - 1350* out of the 2500 words
(*but you may carry over some of the 500 word allocation in Step 3 )
Deadline First Draft: Friday 20 September 2024 - 21h00
Suggested word count of 850 - 1350* out of the 2500 words
(*but you may carry over some of the 500 word allocation in Step 3 )
Deadline First Draft: Friday 20 September 2024 - 21h00
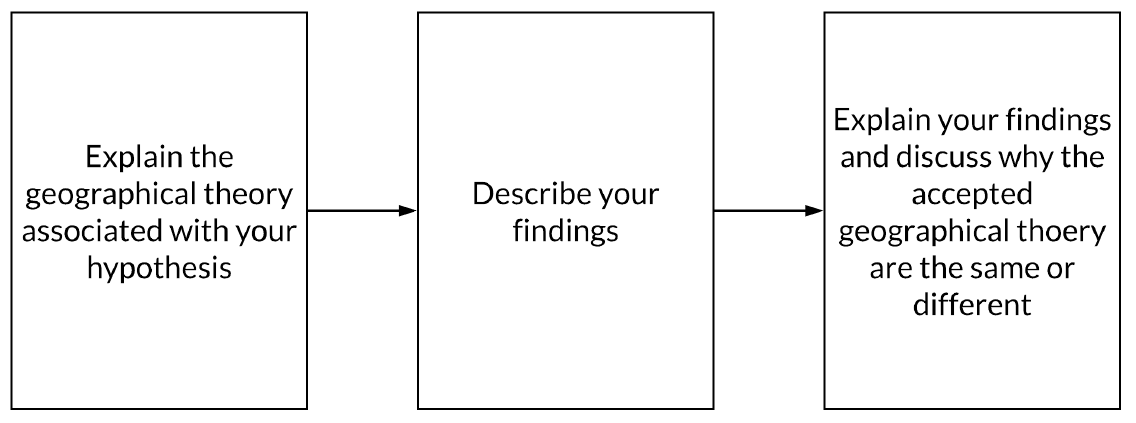
The presentation of your data (graphs etc) and the written analysis must be integrated. That means charts, photos and sketches must be with your written interpretation.
You must demonstrate your knowledge and understanding of the fieldwork investigation by interpreting or explaining the information you have collected.
It is not enough to just describe - you must explain!
You should try to identify and explain anomalies.
Examine each of your sub-hypothesis in turn,using the data you have collected and presented to prove or disprove them. Do not discuss each site separately, discuss / compare both resorts focusing on the data that helps you to answer your RQ's.
Source: Geographyalltheway
|
|
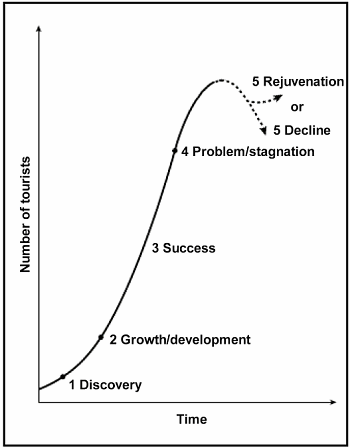
Theory & The Butler Model - what data to use?
|
If you have chosen the Butler Model research question, you must be absolutely sure what the Butler Model is and what evidence you need to be looking for in your data that helps to you place Sitges & Calafell into the correct position.
The Butler Model is a method used to study the evolution of tourism over time and at which stage of the development model a settlement happens to be at this point in time. Tourism is a major source of income for many settlements and those on the Spanish coastline are no exception. Tourism has grown in importance as a major generator of wealth because of three main factors:
(source: Barcelona Field Studies Centre) If you want to find out more about the Butler Model linked to Sitges & Calafell, click here. Start about half way down the page. |

|
The Theory & Tourism Planning, Development & Sustainability - what data to use?
If you have chosen the RQ on differences in tourism development or tourism sustainability and how that changes between Sitges & Calafell, you must be absolutely sure what you are looking for and which data in particular can be used to investigate your hypotheses. What does tourism development mean and how can it be attained? Likewise, how can tourism be sustainable and how might you see evidence of this in both resorts?
The videos below are important to watch if you decide to look at the difference in tourism planning and development between both resorts (first video) or tourism sustainability & growth (second video).
The videos below are important to watch if you decide to look at the difference in tourism planning and development between both resorts (first video) or tourism sustainability & growth (second video).
|
|
|
The benefits of tourism development
Tourism development planning enables a range of benefits to all stakeholders involved, for example:
The costs of tourism development
There are also some costs which must be considered and planned for, which include:
Why tourism planning & development is important
Tourism planning really can make or break a destination. If done well, it can ensure:
If done badly, tourism development can:
Tourism development planning enables a range of benefits to all stakeholders involved, for example:
- It increases income and jobs from tourist spending
- It helps preserve cultural and natural heritage for tourists
- It increases understanding of other cultures
- It builds new facilities such as sewage for whole communities or new roads
The costs of tourism development
There are also some costs which must be considered and planned for, which include:
- Costs of implementing tourist facilities can be costly
- The environment can be destructed to make room for hotels etc. to be built
- Social standards may be undermined e.g. drunken behaviour in Spanish resorts.
- The natural environment may be polluted (air, water, visual etc.)
Why tourism planning & development is important
Tourism planning really can make or break a destination. If done well, it can ensure:
- the longevity of the tourism industry in the area
- take good care of the environment
- have positive economic outcomes
- a positive benefit to the community.
If done badly, tourism development can:
- destroy the very environment or culture that it relies on.
- It can disrupt local economies, cause inflation and negative effects to local people and businesses.
Make sure you do the following...
- Link your discussion to the fieldwork question.
- Explain the patterns don't just describe them!
- Attempt to explain any anomalies.
- Ensure your writing style is clear and use data to illustrate your points.
- Link your discussion to the fieldwork question.
- Explain the patterns don't just describe them!
- Attempt to explain any anomalies.
- Ensure your writing style is clear and use data to illustrate your points.
What the examiner is going to use...
Source: Geographyalltheway