
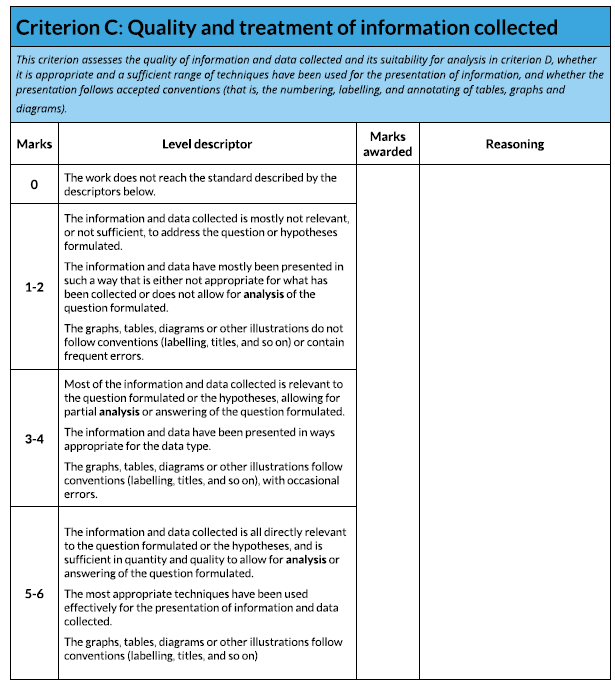
Treatment of information collected...
6 marks available - a lot of these marks are for actions and not words!
Suggested word count of 500 out of the 2500 words. *However, you may not use many words in this section and so can carry them over to Step 4.
Deadline First Draft: Friday 20th September 2024 - 21h00
Suggested word count of 500 out of the 2500 words. *However, you may not use many words in this section and so can carry them over to Step 4.
Deadline First Draft: Friday 20th September 2024 - 21h00
|
The presentation of your data (graphs etc) and the written analysis must be integrated - no random graphs on a single page.
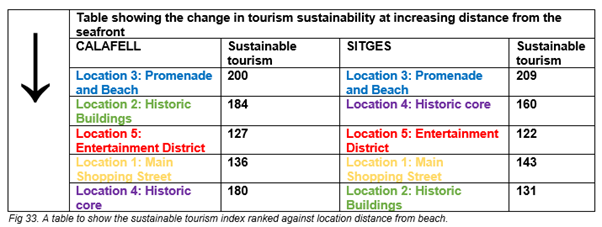
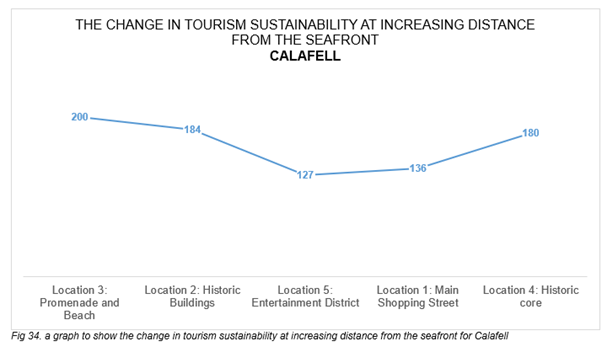
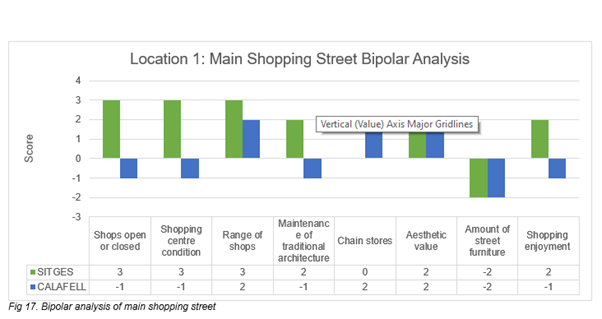
You should treat and display the data collected using the most appropriate techniques. The "most appropriate techniques" are: - the most effective - well used - good quality presentation The presentation of results could involve techniques such as: - Scatter graphs to show how tourism scores changes with the distance from the resort centre - Comparative annotated diagrams/photographs of each zone - Located charts using individual zone maps as the base for the charts - Basic bar charts to show positive / negative values in bipolar survey (see to the right) - Radar charts to show perceptions etc. - Tables to show statistical analysis. Some important points to remember. * Ensure you have looked at the differing scales on the the surveys * Don't show different scaled survey totals on the same chart - perhaps show comparisons between the two towns instead. You should consider including a statistical test that includes confidence limits. A member of the Maths department or a willing IB DP Maths students will lead a session explaining this. A suggested use of a statistical test would be to quantify the strength of relationship between the price of Coca Cola and the relative wealth of that settlement. |
|
Photos 2023...
Reminder of the zones...
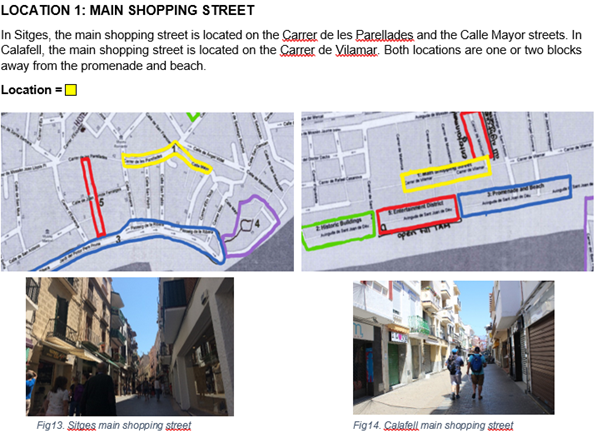
Zone 1 - Main Shopping Street
|
|
|
Zone 2 - Historic Buildings
|
|
|
Zone 3 - Promenade & Beach
|
|
|
Zone 4 - Historic Core
|
|
|
Zone 5 - Entertainment District
|
|
|
If you require any comparisons to see how zones in each of the resorts has changed since 2013, click here to access some old fieldwork videos filmed by Mr Podbury and a group of G11 students
Make sure you have done the following...
- Use the most appropriate methods - just using Excel or Google Sheets to produce graphs may not be the most appropriate method!
- Include a statistical test.
- All the axis are correctly and clearly labeled.
- Use the most appropriate methods - just using Excel or Google Sheets to produce graphs may not be the most appropriate method!
- Include a statistical test.
- All the axis are correctly and clearly labeled.
What the examiner is going to use...
Source: Geographyalltheway